29
/
en
AIzaSyAYiBZKx7MnpbEhh9jyipgxe19OcubqV5w
April 1, 2024
158409
Iraq
IRQ
true
2
1
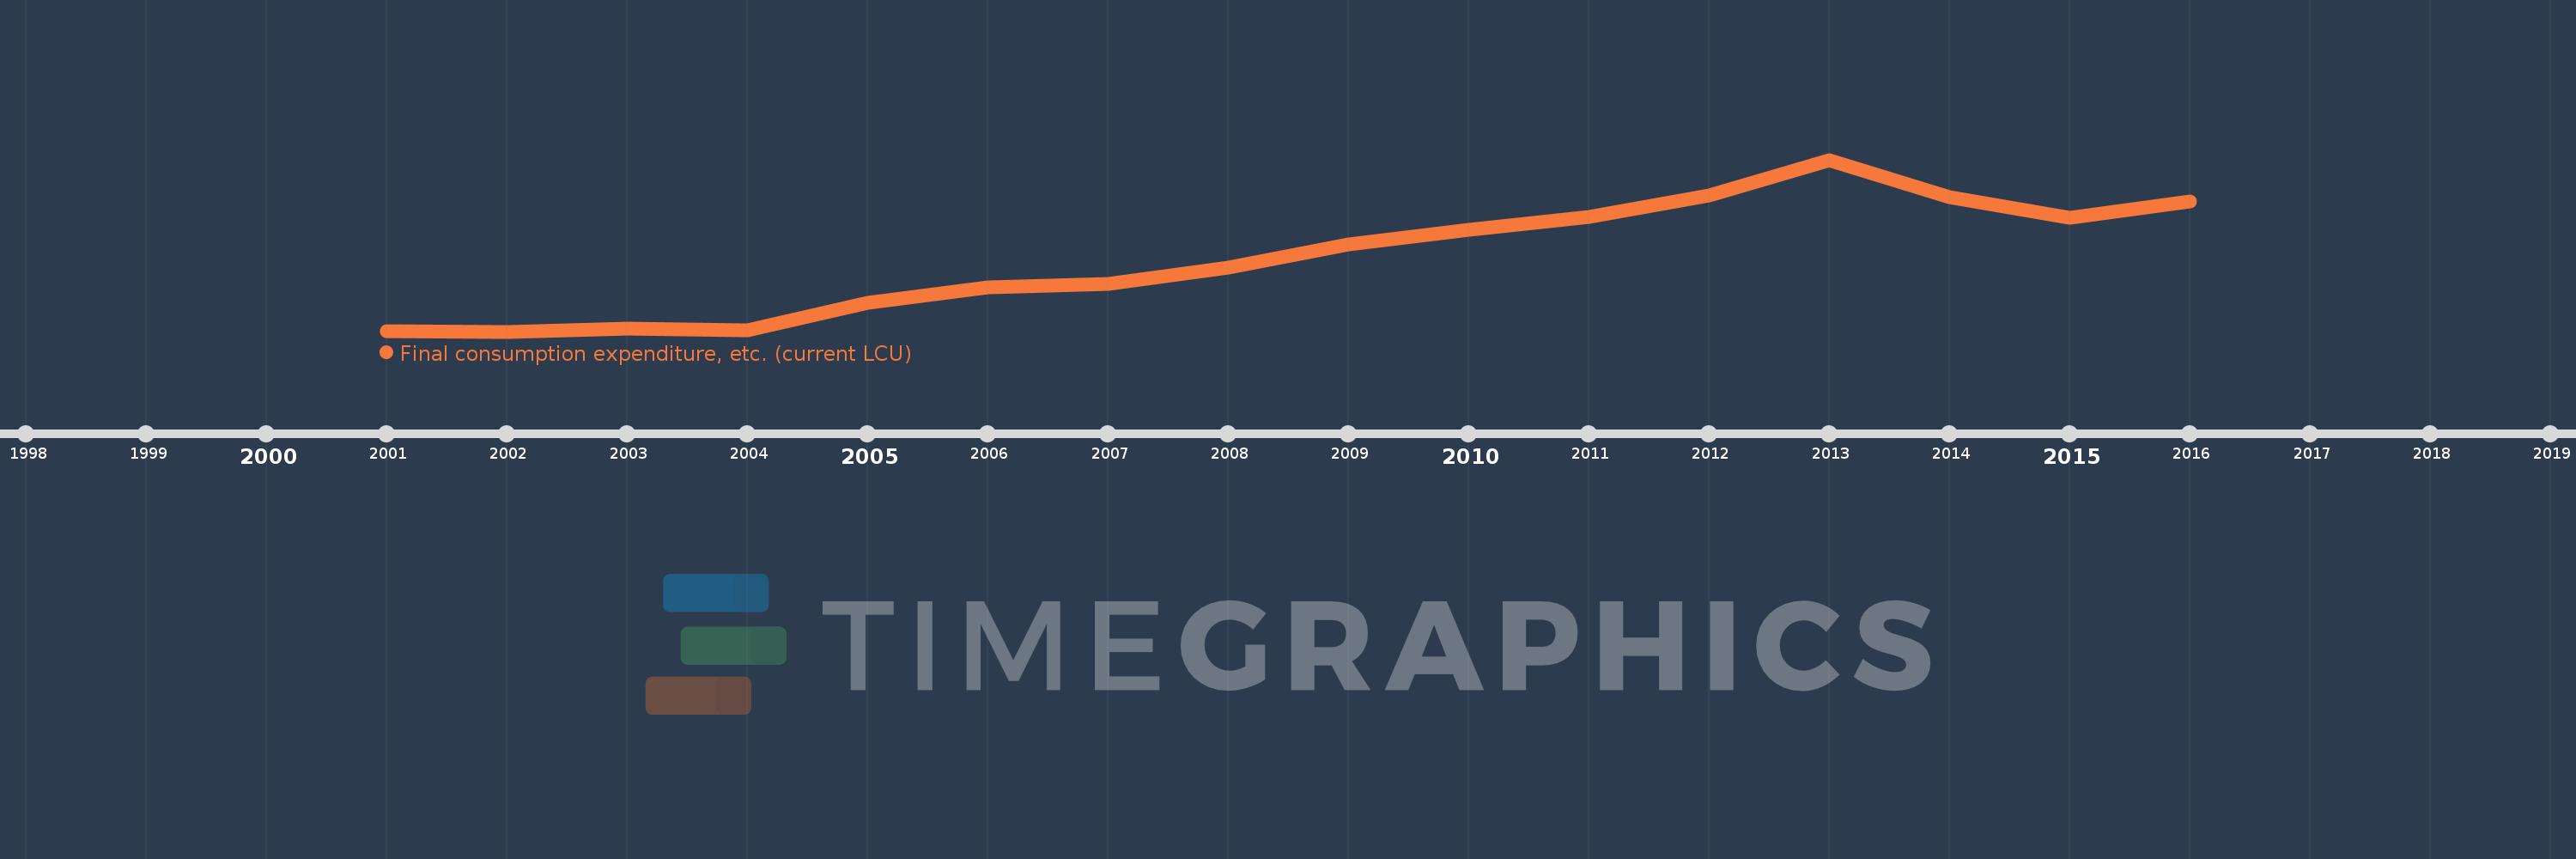
Final consumption expenditure, etc. (current LCU)
2016,2015,2014,2013,2012,2011,2010,2009,2008,2007,2006,2005,2004,2003,2002,2001
This statistics in other country:
AfghanistanAlbaniaAlgeriaAngolaAntigua and BarbudaArgentinaArmeniaArubaAustraliaAustriaAzerbaijanBahamas, TheBahrainBangladeshBarbadosBelarusBelgiumBelizeBeninBermudaBhutanBoliviaBosnia and HerzegovinaBotswanaBrazilBrunei DarussalamBulgariaBurkina FasoBurundiCabo VerdeCambodiaCameroonCanadaCentral African RepublicChadChileChinaColombiaComorosCongo, Dem. Rep.Congo, Rep.Costa RicaCote d'IvoireCroatiaCubaCyprusCzech RepublicDenmarkDjiboutiDominicaDominican RepublicEcuadorEgypt, Arab Rep.El SalvadorEquatorial GuineaEritreaEstoniaEthiopiaFaroe IslandsFijiFinlandFranceGabonGambia, TheGeorgiaGermanyGhanaGreeceGrenadaGuatemalaGuineaGuinea-BissauGuyanaHaitiHondurasHong Kong SAR, ChinaHungaryIcelandIndiaIndonesiaIran, Islamic Rep.IraqIrelandIsraelItalyJamaicaJapanJordanKazakhstanKenyaKiribatiKorea, Rep.KosovoKuwaitKyrgyz RepublicLao PDRLatviaLebanonLesothoLiberiaLibyaLithuaniaLuxembourgMacao SAR, ChinaMacedonia, FYRMadagascarMalawiMalaysiaMaldivesMaliMaltaMauritaniaMauritiusMexicoMicronesia, Fed. Sts.MoldovaMongoliaMontenegroMoroccoMozambiqueNamibiaNepalNetherlandsNew CaledoniaNew ZealandNicaraguaNigerNigeriaNorwayOmanPakistanPanamaPapua New GuineaParaguayPeruPhilippinesPolandPortugalPuerto RicoQatarRomaniaRussian FederationRwandaSaudi ArabiaSenegalSerbiaSeychellesSierra LeoneSingaporeSlovak RepublicSloveniaSolomon IslandsSomaliaSouth AfricaSouth SudanSpainSri LankaSt. Kitts and NevisSt. LuciaSt. Vincent and the GrenadinesSudanSurinameSwazilandSwedenSwitzerlandSyrian Arab RepublicTajikistanTanzaniaThailandTimor-LesteTogoTongaTrinidad and TobagoTunisiaTurkeyTurkmenistanUgandaUkraineUnited Arab EmiratesUnited KingdomUnited StatesUruguayUzbekistanVanuatuVenezuela, RBVietnamWest Bank and GazaYemen, Rep.ZambiaZimbabwe Timeline:
This timeline shows a graph from 2001 to 2016 of Iraq. No data until 2000. Number of actual observations by date: 16.
Source name:
World Development Indicators
Source organization:
World Bank national accounts data, and OECD National Accounts data files.
Categories, topics:
Economy & Growth
Last updated:
apr 23, 2017
Indicators value changes by year
Minimum:
21.819 trl
jan 1, 2002
Maximum:
180.872 trl
jan 1, 2013
At the date of observation
Value
Absolute change
Change from previous value
jan 1, 2001
22.487 trl
+22.487 trl
0.0%
jan 1, 2002
21.819 trl
-667.835 bln
-2.97%
jan 1, 2003
24.776 trl
+2.957 trl
13.55%
jan 1, 2004
23.12 trl
-1.655 trl
-6.68%
jan 1, 2005
48.325 trl
+25.204 trl
109.01%
jan 1, 2006
62.424 trl
+14.099 trl
29.18%
jan 1, 2007
65.639 trl
+3.216 trl
5.15%
jan 1, 2008
81.309 trl
+15.669 trl
23.87%
jan 1, 2009
102.404 trl
+21.096 trl
25.95%
jan 1, 2010
115.737 trl
+13.333 trl
13.02%
jan 1, 2011
127.7 trl
+11.963 trl
10.34%
jan 1, 2012
147.518 trl
+19.818 trl
15.52%
jan 1, 2013
180.872 trl
+33.354 trl
22.61%
jan 1, 2014
146.42 trl
-34.452 trl
-19.05%
jan 1, 2015
127.572 trl
-18.849 trl
-12.87%
jan 1, 2016
142.152 trl
+14.581 trl
11.43%
Ranking of countries by current statistics by years


Comments: