29
/
en
AIzaSyAYiBZKx7MnpbEhh9jyipgxe19OcubqV5w
April 1, 2024
260858
Tanzania
TZA
true
2
1
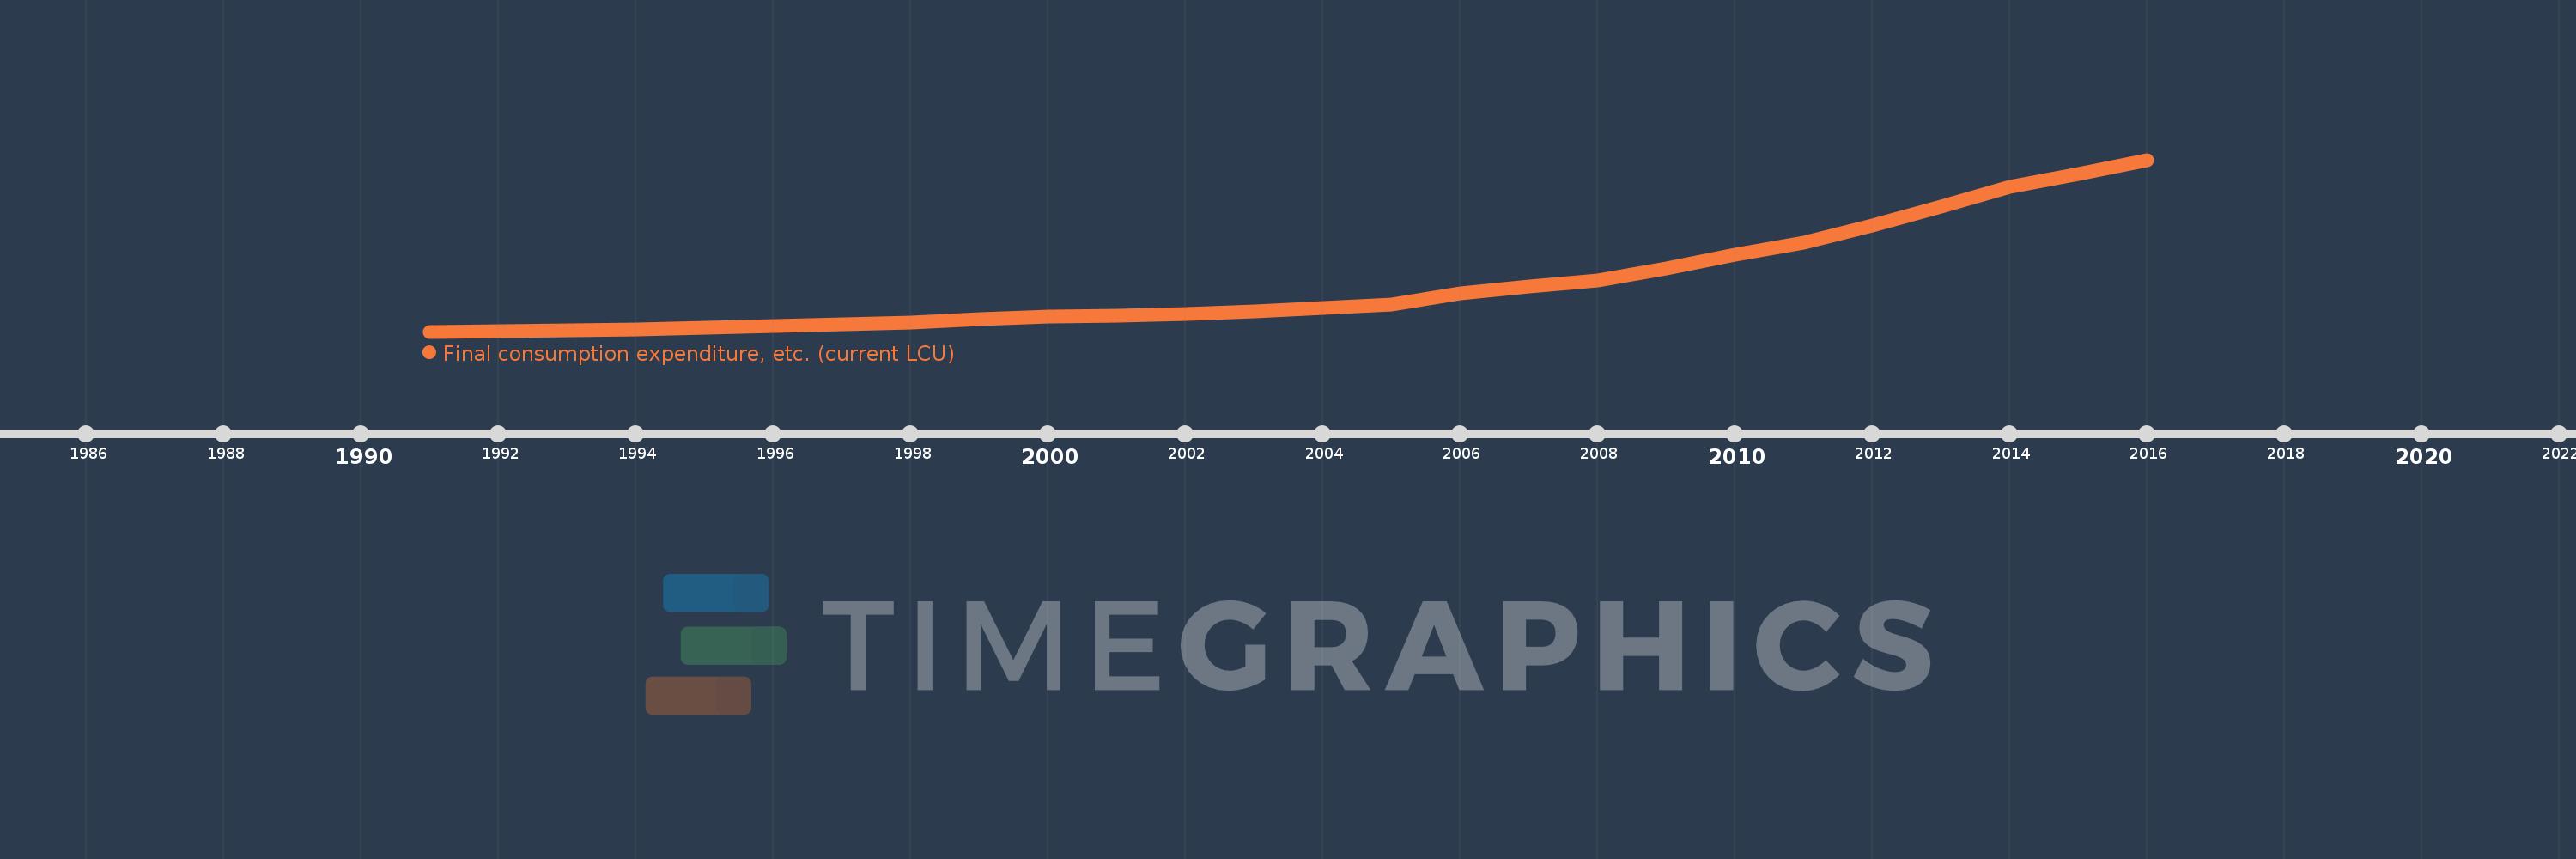
Final consumption expenditure, etc. (current LCU)
2016,2015,2014,2013,2012,2011,2010,2009,2008,2007,2006,2005,2004,2003,2002,2001,2000,1999,1998,1997,1996,1995,1994,1993,1992,1991
This statistics in other country:
AfghanistanAlbaniaAlgeriaAngolaAntigua and BarbudaArgentinaArmeniaArubaAustraliaAustriaAzerbaijanBahamas, TheBahrainBangladeshBarbadosBelarusBelgiumBelizeBeninBermudaBhutanBoliviaBosnia and HerzegovinaBotswanaBrazilBrunei DarussalamBulgariaBurkina FasoBurundiCabo VerdeCambodiaCameroonCanadaCentral African RepublicChadChileChinaColombiaComorosCongo, Dem. Rep.Congo, Rep.Costa RicaCote d'IvoireCroatiaCubaCyprusCzech RepublicDenmarkDjiboutiDominicaDominican RepublicEcuadorEgypt, Arab Rep.El SalvadorEquatorial GuineaEritreaEstoniaEthiopiaFaroe IslandsFijiFinlandFranceGabonGambia, TheGeorgiaGermanyGhanaGreeceGrenadaGuatemalaGuineaGuinea-BissauGuyanaHaitiHondurasHong Kong SAR, ChinaHungaryIcelandIndiaIndonesiaIran, Islamic Rep.IraqIrelandIsraelItalyJamaicaJapanJordanKazakhstanKenyaKiribatiKorea, Rep.KosovoKuwaitKyrgyz RepublicLao PDRLatviaLebanonLesothoLiberiaLibyaLithuaniaLuxembourgMacao SAR, ChinaMacedonia, FYRMadagascarMalawiMalaysiaMaldivesMaliMaltaMauritaniaMauritiusMexicoMicronesia, Fed. Sts.MoldovaMongoliaMontenegroMoroccoMozambiqueNamibiaNepalNetherlandsNew CaledoniaNew ZealandNicaraguaNigerNigeriaNorwayOmanPakistanPanamaPapua New GuineaParaguayPeruPhilippinesPolandPortugalPuerto RicoQatarRomaniaRussian FederationRwandaSaudi ArabiaSenegalSerbiaSeychellesSierra LeoneSingaporeSlovak RepublicSloveniaSolomon IslandsSomaliaSouth AfricaSouth SudanSpainSri LankaSt. Kitts and NevisSt. LuciaSt. Vincent and the GrenadinesSudanSurinameSwazilandSwedenSwitzerlandSyrian Arab RepublicTajikistanTanzaniaThailandTimor-LesteTogoTongaTrinidad and TobagoTunisiaTurkeyTurkmenistanUgandaUkraineUnited Arab EmiratesUnited KingdomUnited StatesUruguayUzbekistanVanuatuVenezuela, RBVietnamWest Bank and GazaYemen, Rep.ZambiaZimbabwe Timeline:
This timeline shows a graph from 1991 to 2016 of Tanzania. No data until 1990. Number of actual observations by date: 26.
Source name:
World Development Indicators
Source organization:
World Bank national accounts data, and OECD National Accounts data files.
Categories, topics:
Economy & Growth
Last updated:
apr 23, 2017
Indicators value changes by year
Minimum:
820.073 bln
jan 1, 1991
Maximum:
69.826 trl
jan 1, 2016
At the date of observation
Value
Absolute change
Change from previous value
jan 1, 1991
820.073 bln
+820.073 bln
0.0%
jan 1, 1992
1.054 trl
+234.066 bln
28.54%
jan 1, 1993
1.365 trl
+311.355 bln
29.54%
jan 1, 1994
1.805 trl
+439.402 bln
32.18%
jan 1, 1995
2.261 trl
+456.303 bln
25.28%
jan 1, 1996
2.949 trl
+688.113 bln
30.43%
jan 1, 1997
3.593 trl
+643.841 bln
21.83%
jan 1, 1998
4.448 trl
+854.987 bln
23.79%
jan 1, 1999
5.747 trl
+1.298 trl
29.19%
jan 1, 2000
6.701 trl
+954.845 bln
16.62%
jan 1, 2001
7.333 trl
+631.592 bln
9.42%
jan 1, 2002
7.902 trl
+568.696 bln
7.76%
jan 1, 2003
8.885 trl
+983.336 bln
12.44%
jan 1, 2004
10.301 trl
+1.416 trl
15.93%
jan 1, 2005
11.714 trl
+1.414 trl
13.72%
jan 1, 2006
16.013 trl
+4.299 trl
36.7%
jan 1, 2007
19.073 trl
+3.06 trl
19.11%
jan 1, 2008
21.394 trl
+2.321 trl
12.17%
jan 1, 2009
26.233 trl
+4.839 trl
22.62%
jan 1, 2010
31.607 trl
+5.374 trl
20.49%
jan 1, 2011
36.422 trl
+4.815 trl
15.23%
jan 1, 2012
43.287 trl
+6.865 trl
18.85%
jan 1, 2013
51.189 trl
+7.902 trl
18.25%
jan 1, 2014
58.958 trl
+7.769 trl
15.18%
jan 1, 2015
63.969 trl
+5.011 trl
8.5%
jan 1, 2016
69.826 trl
+5.858 trl
9.16%
Ranking of countries by current statistics by years


Comments: