29
/
en
AIzaSyAYiBZKx7MnpbEhh9jyipgxe19OcubqV5w
April 1, 2024
149106
Haiti
HTI
true
2
1
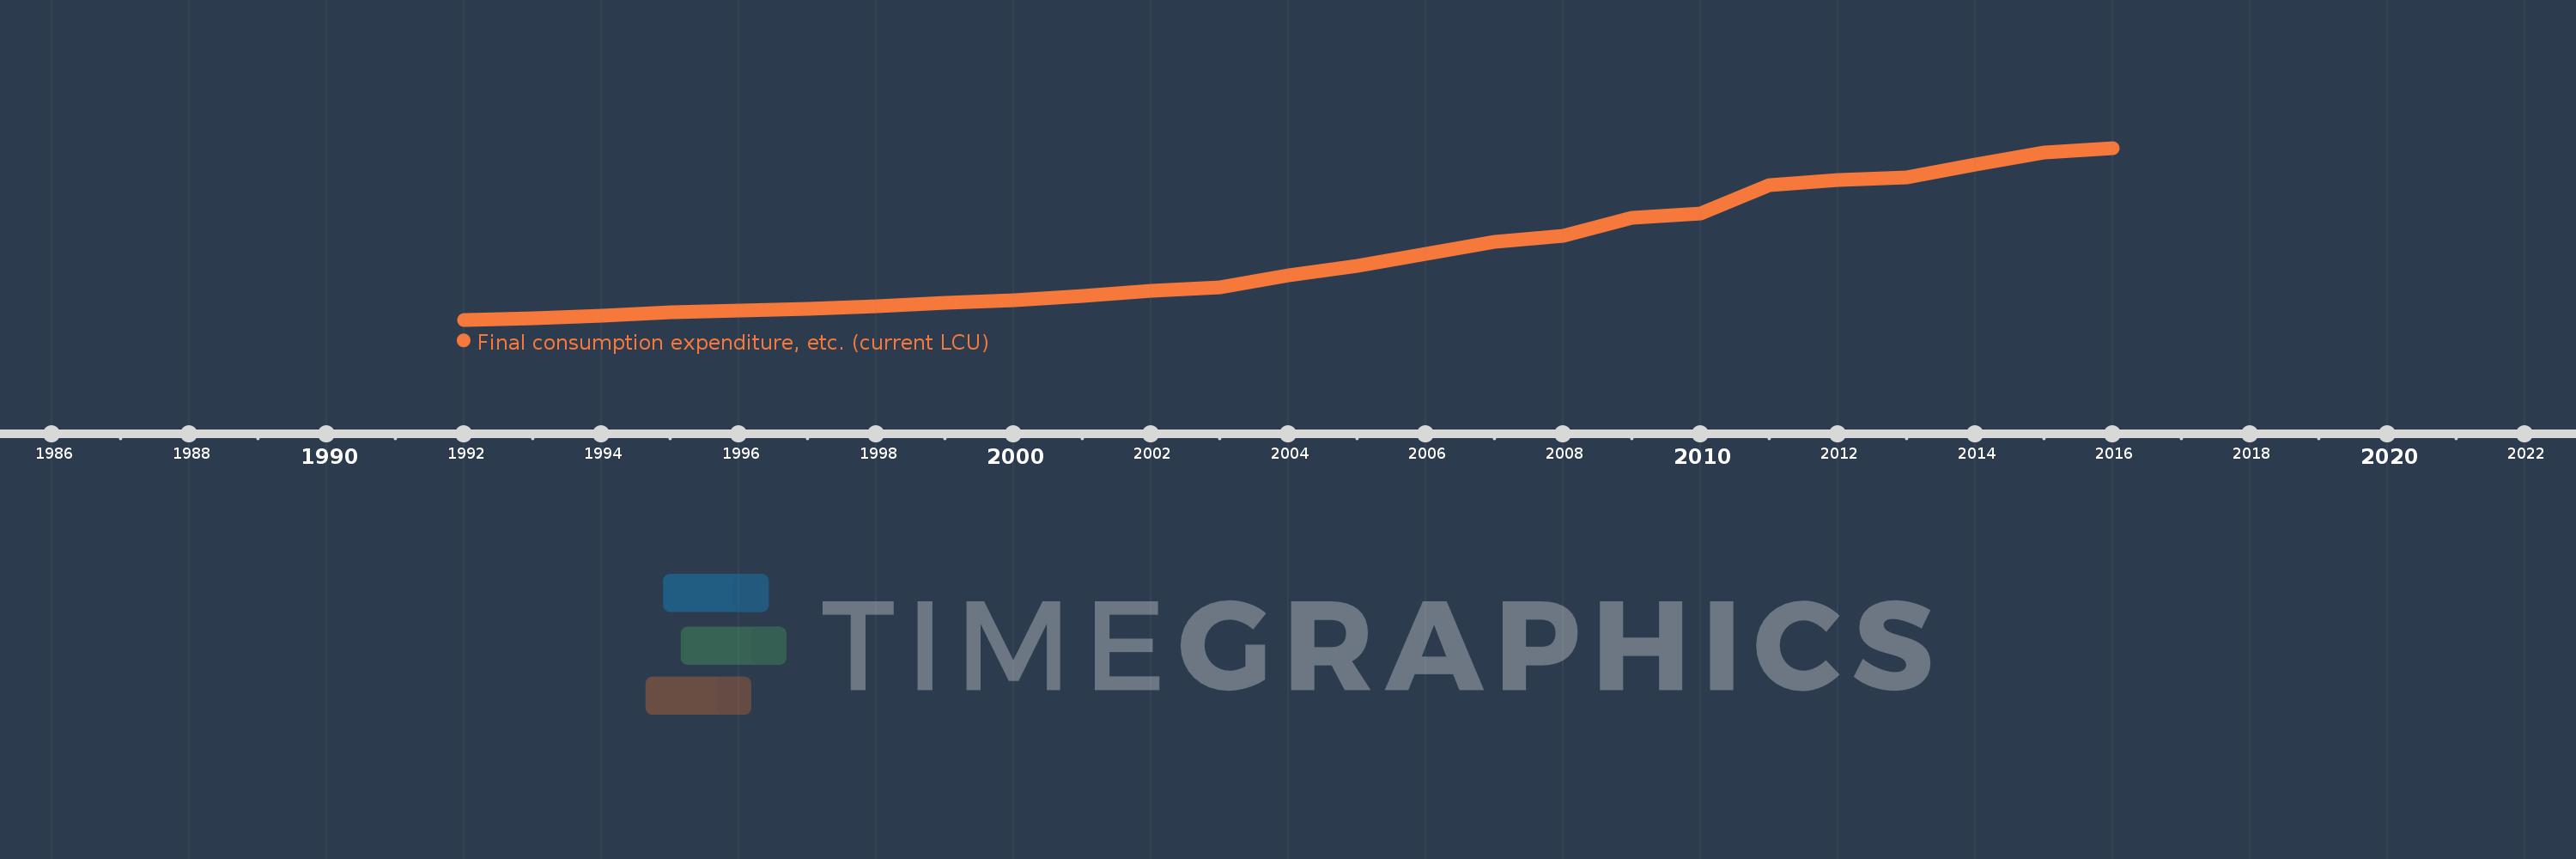
Final consumption expenditure, etc. (current LCU)
2016,2015,2014,2013,2012,2011,2010,2009,2008,2007,2006,2005,2004,2003,2002,2001,2000,1999,1998,1997,1996,1995,1994,1993,1992
This statistics in other country:
AfghanistanAlbaniaAlgeriaAngolaAntigua and BarbudaArgentinaArmeniaArubaAustraliaAustriaAzerbaijanBahamas, TheBahrainBangladeshBarbadosBelarusBelgiumBelizeBeninBermudaBhutanBoliviaBosnia and HerzegovinaBotswanaBrazilBrunei DarussalamBulgariaBurkina FasoBurundiCabo VerdeCambodiaCameroonCanadaCentral African RepublicChadChileChinaColombiaComorosCongo, Dem. Rep.Congo, Rep.Costa RicaCote d'IvoireCroatiaCubaCyprusCzech RepublicDenmarkDjiboutiDominicaDominican RepublicEcuadorEgypt, Arab Rep.El SalvadorEquatorial GuineaEritreaEstoniaEthiopiaFaroe IslandsFijiFinlandFranceGabonGambia, TheGeorgiaGermanyGhanaGreeceGrenadaGuatemalaGuineaGuinea-BissauGuyanaHaitiHondurasHong Kong SAR, ChinaHungaryIcelandIndiaIndonesiaIran, Islamic Rep.IraqIrelandIsraelItalyJamaicaJapanJordanKazakhstanKenyaKiribatiKorea, Rep.KosovoKuwaitKyrgyz RepublicLao PDRLatviaLebanonLesothoLiberiaLibyaLithuaniaLuxembourgMacao SAR, ChinaMacedonia, FYRMadagascarMalawiMalaysiaMaldivesMaliMaltaMauritaniaMauritiusMexicoMicronesia, Fed. Sts.MoldovaMongoliaMontenegroMoroccoMozambiqueNamibiaNepalNetherlandsNew CaledoniaNew ZealandNicaraguaNigerNigeriaNorwayOmanPakistanPanamaPapua New GuineaParaguayPeruPhilippinesPolandPortugalPuerto RicoQatarRomaniaRussian FederationRwandaSaudi ArabiaSenegalSerbiaSeychellesSierra LeoneSingaporeSlovak RepublicSloveniaSolomon IslandsSomaliaSouth AfricaSouth SudanSpainSri LankaSt. Kitts and NevisSt. LuciaSt. Vincent and the GrenadinesSudanSurinameSwazilandSwedenSwitzerlandSyrian Arab RepublicTajikistanTanzaniaThailandTimor-LesteTogoTongaTrinidad and TobagoTunisiaTurkeyTurkmenistanUgandaUkraineUnited Arab EmiratesUnited KingdomUnited StatesUruguayUzbekistanVanuatuVenezuela, RBVietnamWest Bank and GazaYemen, Rep.ZambiaZimbabwe Timeline:
This timeline shows a graph from 1992 to 2016 of Haiti. No data until 1991. Number of actual observations by date: 25.
Source name:
World Development Indicators
Source organization:
World Bank national accounts data, and OECD National Accounts data files.
Categories, topics:
Economy & Growth
Last updated:
apr 23, 2017
Indicators value changes by year
Minimum:
17.14 bln
jan 1, 1992
Maximum:
418.49 bln
jan 1, 2016
At the date of observation
Value
Absolute change
Change from previous value
jan 1, 1992
17.14 bln
+17.14 bln
0.0%
jan 1, 1993
19.718 bln
+2.578 bln
15.04%
jan 1, 1994
26.225 bln
+6.507 bln
33.0%
jan 1, 1995
34.545 bln
+8.32 bln
31.73%
jan 1, 1996
38.078 bln
+3.533 bln
10.23%
jan 1, 1997
41.72 bln
+3.642 bln
9.56%
jan 1, 1998
49.393 bln
+7.673 bln
18.39%
jan 1, 1999
57.148 bln
+7.755 bln
15.7%
jan 1, 2000
62.157 bln
+5.009 bln
8.76%
jan 1, 2001
72.446 bln
+10.289 bln
16.55%
jan 1, 2002
83.921 bln
+11.475 bln
15.84%
jan 1, 2003
92.906 bln
+8.985 bln
10.71%
jan 1, 2004
121.285 bln
+28.379 bln
30.55%
jan 1, 2005
143.138 bln
+21.853 bln
18.02%
jan 1, 2006
170.525 bln
+27.387 bln
19.13%
jan 1, 2007
199.482 bln
+28.957 bln
16.98%
jan 1, 2008
212.654 bln
+13.172 bln
6.6%
jan 1, 2009
255.646 bln
+42.992 bln
20.22%
jan 1, 2010
266.197 bln
+10.551 bln
4.13%
jan 1, 2011
331.02 bln
+64.823 bln
24.35%
jan 1, 2012
344.247 bln
+13.227 bln
4.0%
jan 1, 2013
350.07 bln
+5.823 bln
1.69%
jan 1, 2014
379.137 bln
+29.067 bln
8.3%
jan 1, 2015
408.461 bln
+29.324 bln
7.73%
jan 1, 2016
418.49 bln
+10.029 bln
2.46%
Ranking of countries by current statistics by years


Comments: