29
/
en
AIzaSyAYiBZKx7MnpbEhh9jyipgxe19OcubqV5w
April 1, 2024
172804
Kyrgyz Republic
KGZ
true
2
1
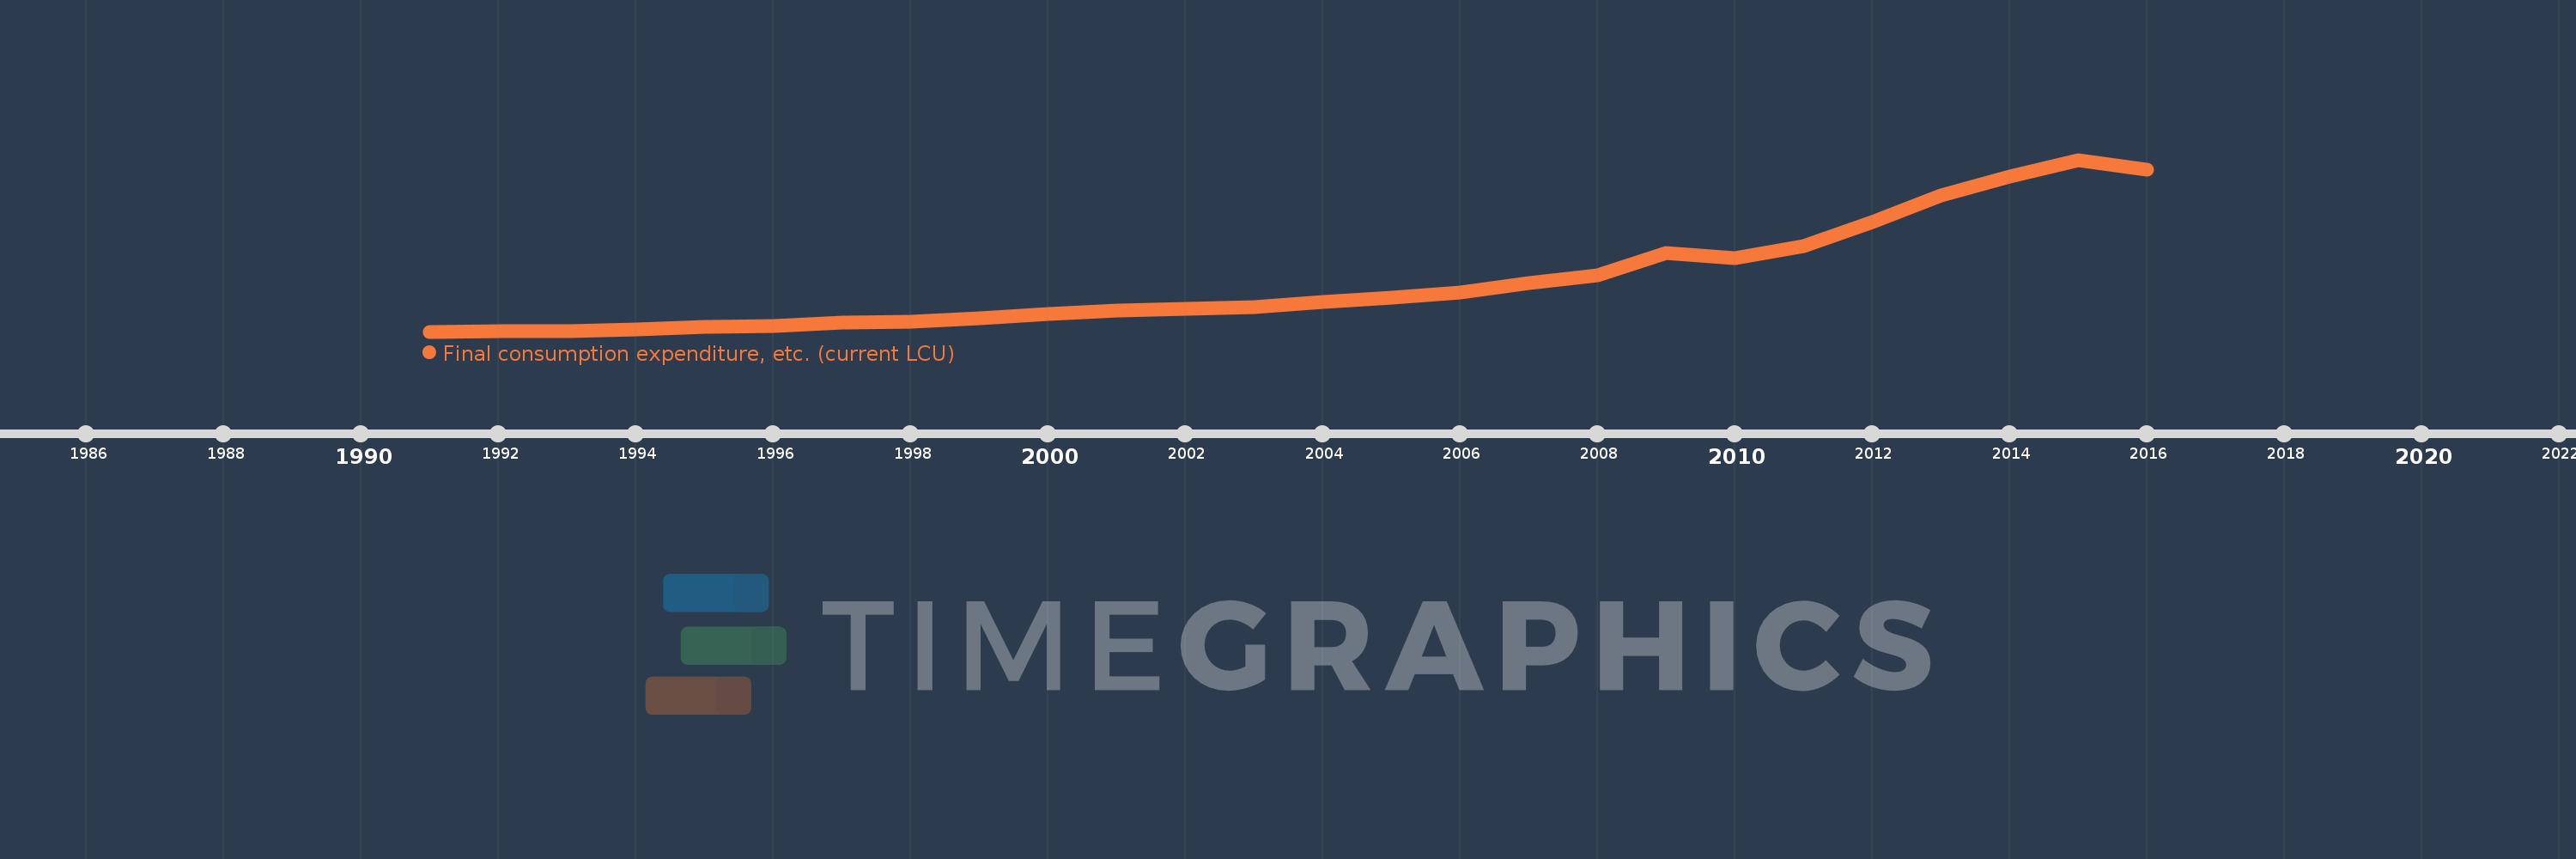
Final consumption expenditure, etc. (current LCU)
2016,2015,2014,2013,2012,2011,2010,2009,2008,2007,2006,2005,2004,2003,2002,2001,2000,1999,1998,1997,1996,1995,1994,1993,1992,1991
This statistics in other country:
AfghanistanAlbaniaAlgeriaAngolaAntigua and BarbudaArgentinaArmeniaArubaAustraliaAustriaAzerbaijanBahamas, TheBahrainBangladeshBarbadosBelarusBelgiumBelizeBeninBermudaBhutanBoliviaBosnia and HerzegovinaBotswanaBrazilBrunei DarussalamBulgariaBurkina FasoBurundiCabo VerdeCambodiaCameroonCanadaCentral African RepublicChadChileChinaColombiaComorosCongo, Dem. Rep.Congo, Rep.Costa RicaCote d'IvoireCroatiaCubaCyprusCzech RepublicDenmarkDjiboutiDominicaDominican RepublicEcuadorEgypt, Arab Rep.El SalvadorEquatorial GuineaEritreaEstoniaEthiopiaFaroe IslandsFijiFinlandFranceGabonGambia, TheGeorgiaGermanyGhanaGreeceGrenadaGuatemalaGuineaGuinea-BissauGuyanaHaitiHondurasHong Kong SAR, ChinaHungaryIcelandIndiaIndonesiaIran, Islamic Rep.IraqIrelandIsraelItalyJamaicaJapanJordanKazakhstanKenyaKiribatiKorea, Rep.KosovoKuwaitKyrgyz RepublicLao PDRLatviaLebanonLesothoLiberiaLibyaLithuaniaLuxembourgMacao SAR, ChinaMacedonia, FYRMadagascarMalawiMalaysiaMaldivesMaliMaltaMauritaniaMauritiusMexicoMicronesia, Fed. Sts.MoldovaMongoliaMontenegroMoroccoMozambiqueNamibiaNepalNetherlandsNew CaledoniaNew ZealandNicaraguaNigerNigeriaNorwayOmanPakistanPanamaPapua New GuineaParaguayPeruPhilippinesPolandPortugalPuerto RicoQatarRomaniaRussian FederationRwandaSaudi ArabiaSenegalSerbiaSeychellesSierra LeoneSingaporeSlovak RepublicSloveniaSolomon IslandsSomaliaSouth AfricaSouth SudanSpainSri LankaSt. Kitts and NevisSt. LuciaSt. Vincent and the GrenadinesSudanSurinameSwazilandSwedenSwitzerlandSyrian Arab RepublicTajikistanTanzaniaThailandTimor-LesteTogoTongaTrinidad and TobagoTunisiaTurkeyTurkmenistanUgandaUkraineUnited Arab EmiratesUnited KingdomUnited StatesUruguayUzbekistanVanuatuVenezuela, RBVietnamWest Bank and GazaYemen, Rep.ZambiaZimbabwe Timeline:
This timeline shows a graph from 1991 to 2016 of Kyrgyz Republic. No data until 1990. Number of actual observations by date: 26.
Source name:
World Development Indicators
Source organization:
World Bank national accounts data, and OECD National Accounts data files.
Categories, topics:
Economy & Growth
Last updated:
apr 23, 2017
Indicators value changes by year
Minimum:
41.139 mln
jan 1, 1991
Maximum:
454.676 bln
jan 1, 2015
At the date of observation
Value
Absolute change
Change from previous value
jan 1, 1991
41.139 mln
+41.139 mln
0.0%
jan 1, 1992
79.519 mln
+38.38 mln
93.29%
jan 1, 1993
682.645 mln
+603.126 mln
758.47%
jan 1, 1994
5.139 bln
+4.457 bln
652.85%
jan 1, 1995
11.694 bln
+6.555 bln
127.54%
jan 1, 1996
15.265 bln
+3.572 bln
30.54%
jan 1, 1997
23.545 bln
+8.279 bln
54.24%
jan 1, 1998
26.458 bln
+2.913 bln
12.37%
jan 1, 1999
36.266 bln
+9.808 bln
37.07%
jan 1, 2000
47.168 bln
+10.902 bln
30.06%
jan 1, 2001
56.028 bln
+8.86 bln
18.78%
jan 1, 2002
60.805 bln
+4.777 bln
8.53%
jan 1, 2003
64.929 bln
+4.125 bln
6.78%
jan 1, 2004
79.46 bln
+14.531 bln
22.38%
jan 1, 2005
88.893 bln
+9.433 bln
11.87%
jan 1, 2006
102.972 bln
+14.079 bln
15.84%
jan 1, 2007
128.723 bln
+25.75 bln
25.01%
jan 1, 2008
148.41 bln
+19.687 bln
15.29%
jan 1, 2009
206.902 bln
+58.492 bln
39.41%
jan 1, 2010
194.607 bln
-12.296 bln
-5.94%
jan 1, 2011
226.369 bln
+31.762 bln
16.32%
jan 1, 2012
290.651 bln
+64.281 bln
28.4%
jan 1, 2013
359.856 bln
+69.206 bln
23.81%
jan 1, 2014
410.819 bln
+50.963 bln
14.16%
jan 1, 2015
454.676 bln
+43.857 bln
10.68%
jan 1, 2016
429.323 bln
-25.353 bln
-5.58%
Ranking of countries by current statistics by years


Comments: