29
/
en
AIzaSyAYiBZKx7MnpbEhh9jyipgxe19OcubqV5w
April 1, 2024
202881
Mozambique
MOZ
true
2
1
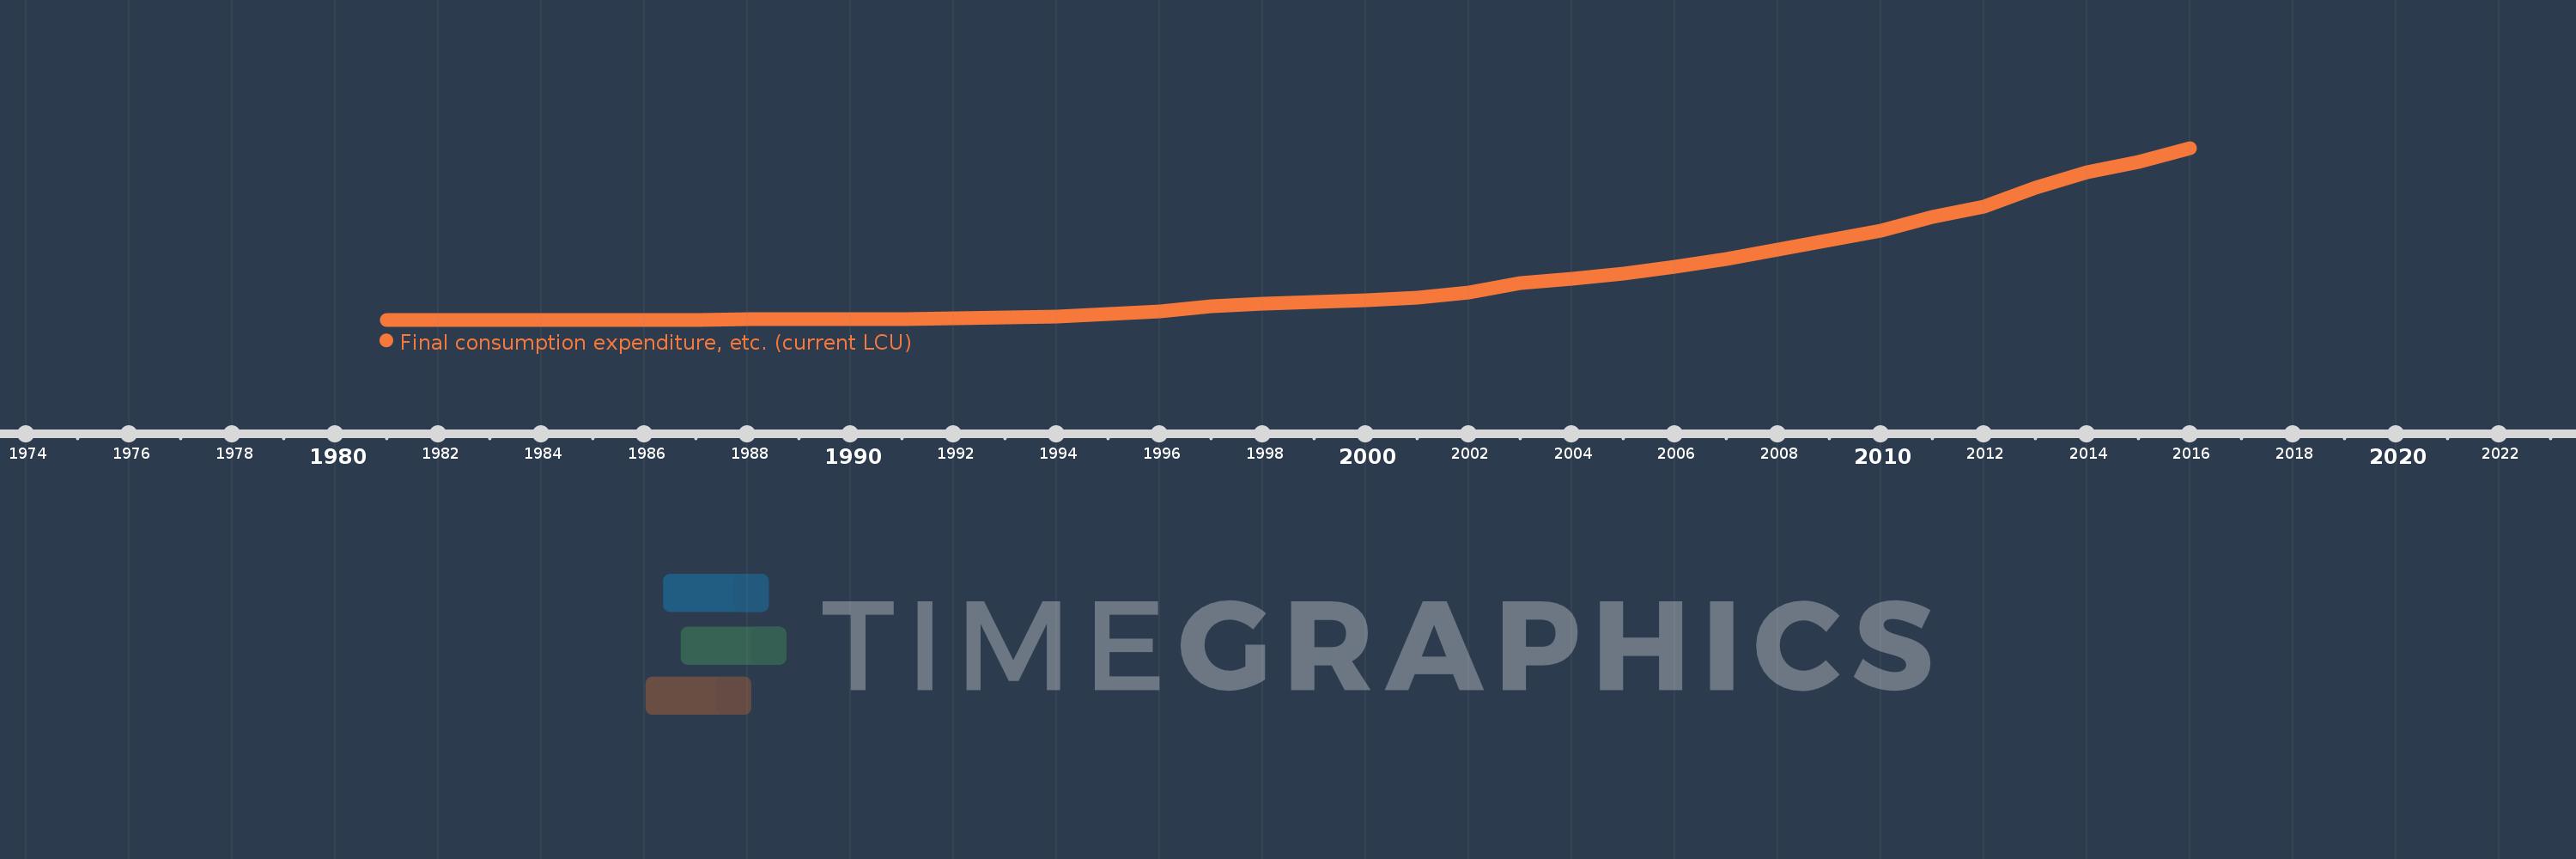
Final consumption expenditure, etc. (current LCU)
2016,2015,2014,2013,2012,2011,2010,2009,2008,2007,2006,2005,2004,2003,2002,2001,2000,1999,1998,1997,1996,1995,1994,1993,1992,1991,1990,1989,1988,1987,1986,1985,1984,1983,1982,1981
This statistics in other country:
AfghanistanAlbaniaAlgeriaAngolaAntigua and BarbudaArgentinaArmeniaArubaAustraliaAustriaAzerbaijanBahamas, TheBahrainBangladeshBarbadosBelarusBelgiumBelizeBeninBermudaBhutanBoliviaBosnia and HerzegovinaBotswanaBrazilBrunei DarussalamBulgariaBurkina FasoBurundiCabo VerdeCambodiaCameroonCanadaCentral African RepublicChadChileChinaColombiaComorosCongo, Dem. Rep.Congo, Rep.Costa RicaCote d'IvoireCroatiaCubaCyprusCzech RepublicDenmarkDjiboutiDominicaDominican RepublicEcuadorEgypt, Arab Rep.El SalvadorEquatorial GuineaEritreaEstoniaEthiopiaFaroe IslandsFijiFinlandFranceGabonGambia, TheGeorgiaGermanyGhanaGreeceGrenadaGuatemalaGuineaGuinea-BissauGuyanaHaitiHondurasHong Kong SAR, ChinaHungaryIcelandIndiaIndonesiaIran, Islamic Rep.IraqIrelandIsraelItalyJamaicaJapanJordanKazakhstanKenyaKiribatiKorea, Rep.KosovoKuwaitKyrgyz RepublicLao PDRLatviaLebanonLesothoLiberiaLibyaLithuaniaLuxembourgMacao SAR, ChinaMacedonia, FYRMadagascarMalawiMalaysiaMaldivesMaliMaltaMauritaniaMauritiusMexicoMicronesia, Fed. Sts.MoldovaMongoliaMontenegroMoroccoMozambiqueNamibiaNepalNetherlandsNew CaledoniaNew ZealandNicaraguaNigerNigeriaNorwayOmanPakistanPanamaPapua New GuineaParaguayPeruPhilippinesPolandPortugalPuerto RicoQatarRomaniaRussian FederationRwandaSaudi ArabiaSenegalSerbiaSeychellesSierra LeoneSingaporeSlovak RepublicSloveniaSolomon IslandsSomaliaSouth AfricaSouth SudanSpainSri LankaSt. Kitts and NevisSt. LuciaSt. Vincent and the GrenadinesSudanSurinameSwazilandSwedenSwitzerlandSyrian Arab RepublicTajikistanTanzaniaThailandTimor-LesteTogoTongaTrinidad and TobagoTunisiaTurkeyTurkmenistanUgandaUkraineUnited Arab EmiratesUnited KingdomUnited StatesUruguayUzbekistanVanuatuVenezuela, RBVietnamWest Bank and GazaYemen, Rep.ZambiaZimbabwe Timeline:
This timeline shows a graph from 1981 to 2016 of Mozambique. No data until 1980. Number of actual observations by date: 36.
Source name:
World Development Indicators
Source organization:
World Bank national accounts data, and OECD National Accounts data files.
Categories, topics:
Economy & Growth
Last updated:
apr 23, 2017
Indicators value changes by year
Minimum:
124.38 mln
jan 1, 1981
Maximum:
556.965 bln
jan 1, 2016
At the date of observation
Value
Absolute change
Change from previous value
jan 1, 1981
124.38 mln
+124.38 mln
0.0%
jan 1, 1982
132.696 mln
+8.316 mln
6.69%
jan 1, 1983
145.438 mln
+12.741 mln
9.6%
jan 1, 1984
136.67 mln
-8.768 mln
-6.03%
jan 1, 1985
146.773 mln
+10.103 mln
7.39%
jan 1, 1986
202.423 mln
+55.65 mln
37.92%
jan 1, 1987
217.234 mln
+14.811 mln
7.32%
jan 1, 1988
737.24 mln
+520.005 mln
239.38%
jan 1, 1989
1.184 bln
+446.719 mln
60.59%
jan 1, 1990
1.886 bln
+702.242 mln
59.31%
jan 1, 1991
2.47 bln
+583.756 mln
30.95%
jan 1, 1992
5.303 bln
+2.833 bln
114.69%
jan 1, 1993
7.032 bln
+1.73 bln
32.62%
jan 1, 1994
10.973 bln
+3.941 bln
56.03%
jan 1, 1995
18.085 bln
+7.112 bln
64.82%
jan 1, 1996
26.453 bln
+8.368 bln
46.27%
jan 1, 1997
43.516 bln
+17.063 bln
64.5%
jan 1, 1998
51.084 bln
+7.568 bln
17.39%
jan 1, 1999
56.71 bln
+5.626 bln
11.01%
jan 1, 2000
63.067 bln
+6.357 bln
11.21%
jan 1, 2001
71.494 bln
+8.427 bln
13.36%
jan 1, 2002
87.3 bln
+15.805 bln
22.11%
jan 1, 2003
117.931 bln
+30.632 bln
35.09%
jan 1, 2004
132.693 bln
+14.762 bln
12.52%
jan 1, 2005
150.889 bln
+18.196 bln
13.71%
jan 1, 2006
172.713 bln
+21.824 bln
14.46%
jan 1, 2007
195.877 bln
+23.164 bln
13.41%
jan 1, 2008
227.382 bln
+31.505 bln
16.08%
jan 1, 2009
258.619 bln
+31.236 bln
13.74%
jan 1, 2010
290.126 bln
+31.508 bln
12.18%
jan 1, 2011
332.479 bln
+42.352 bln
14.6%
jan 1, 2012
365.714 bln
+33.235 bln
10.0%
jan 1, 2013
427.472 bln
+61.758 bln
16.89%
jan 1, 2014
478.223 bln
+50.751 bln
11.87%
jan 1, 2015
510.726 bln
+32.503 bln
6.8%
jan 1, 2016
556.965 bln
+46.239 bln
9.05%
Ranking of countries by current statistics by years


Comments: