29
/
en
AIzaSyAYiBZKx7MnpbEhh9jyipgxe19OcubqV5w
April 1, 2024
61136
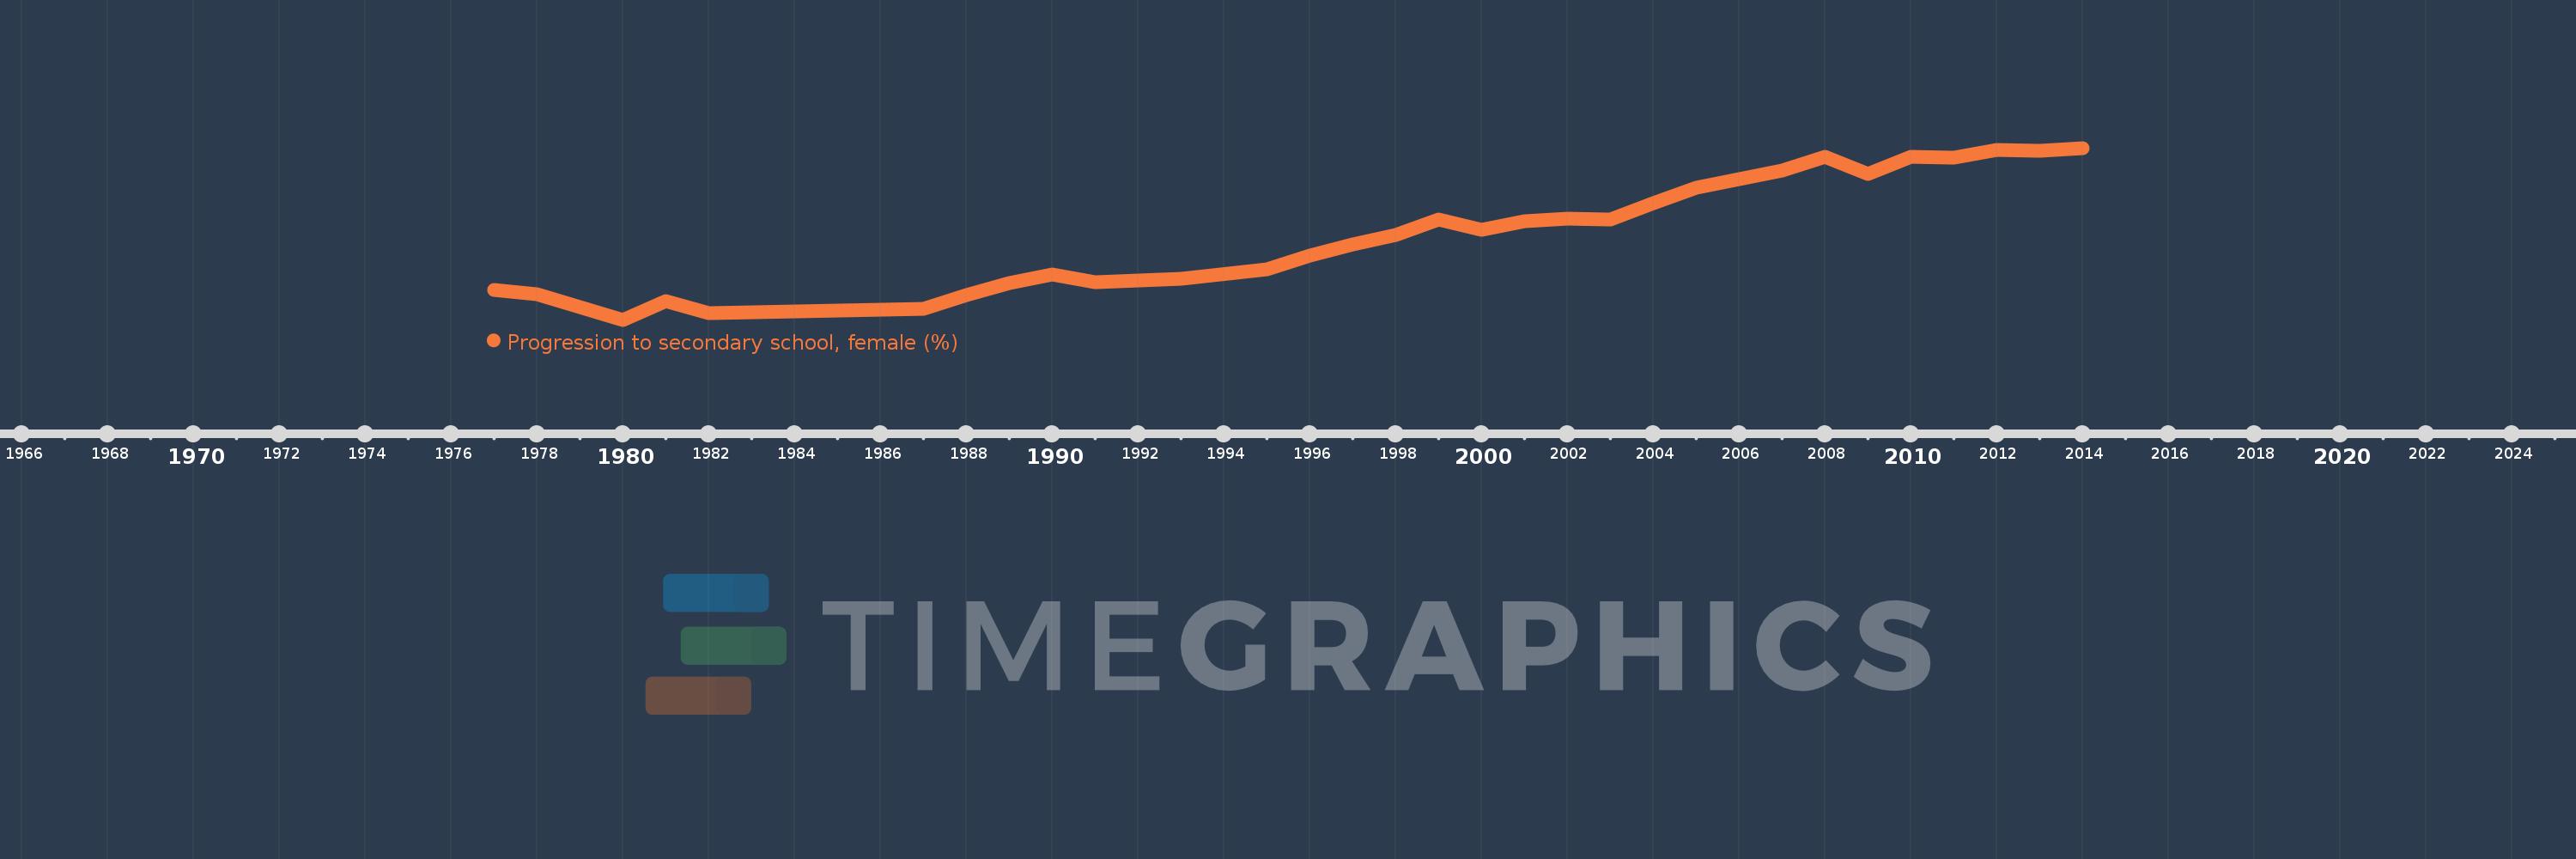
Sub-Saharan Africa (IDA & IBRD countries)
TSS
false
2
1
Progression to secondary school, female (%)
2014,2013,2012,2011,2010,2009,2008,2007,2006,2005,2004,2003,2002,2001,2000,1999,1998,1997,1996,1995,1993,1991,1990,1989,1988,1987,1982,1981,1980,1979,1978,1977
This statistics in other country:
AfghanistanAlbaniaAlgeriaAngolaAntigua and BarbudaArab WorldArgentinaArmeniaArubaAustriaAzerbaijanBahamas, TheBahrainBarbadosBelarusBelgiumBelizeBeninBermudaBhutanBoliviaBosnia and HerzegovinaBotswanaBrazilBritish Virgin IslandsBrunei DarussalamBulgariaBurkina FasoBurundiCabo VerdeCambodiaCameroonCaribbean small statesCayman IslandsCentral African RepublicCentral Europe and the BalticsChadChileChinaColombiaComorosCongo, Dem. Rep.Congo, Rep.Costa RicaCote d'IvoireCroatiaCubaCyprusCzech RepublicDenmarkDjiboutiDominicaDominican RepublicEarly-demographic dividendEast Asia & PacificEast Asia & Pacific (excluding high income)East Asia & Pacific (IDA & IBRD countries)EcuadorEgypt, Arab Rep.El SalvadorEquatorial GuineaEritreaEstoniaEthiopiaEuro areaEurope & Central AsiaEurope & Central Asia (excluding high income)Europe & Central Asia (IDA & IBRD countries)European UnionFijiFinlandFragile and conflict affected situationsGabonGambia, TheGeorgiaGermanyGhanaGreeceGrenadaGuatemalaGuineaGuinea-BissauGuyanaHaitiHeavily indebted poor countries (HIPC)High incomeHondurasHong Kong SAR, ChinaHungaryIBRD onlyIcelandIDA & IBRD totalIDA blendIDA onlyIDA totalIndiaIndonesiaIran, Islamic Rep.IraqIsraelItalyJamaicaJapanJordanKazakhstanKenyaKiribatiKorea, Rep.KuwaitKyrgyz RepublicLao PDRLate-demographic dividendLatin America & Caribbean Latin America & Caribbean (excluding high income)Latin America & the Caribbean (IDA & IBRD countries)LatviaLeast developed countries: UN classificationLebanonLesothoLiberiaLibyaLiechtensteinLithuaniaLow & middle incomeLow incomeLower middle incomeLuxembourgMacao SAR, ChinaMacedonia, FYRMadagascarMalawiMalaysiaMaldivesMaliMaltaMarshall IslandsMauritaniaMauritiusMexicoMiddle East & North AfricaMiddle East & North Africa (excluding high income)Middle East & North Africa (IDA & IBRD countries)Middle incomeMoldovaMonacoMongoliaMoroccoMozambiqueMyanmarNamibiaNepalNetherlandsNicaraguaNigerNorwayOECD membersOmanOther small statesPacific island small statesPakistanPalauPanamaParaguayPeruPhilippinesPolandPortugalPost-demographic dividendPre-demographic dividendQatarRomaniaRussian FederationRwandaSamoaSan MarinoSao Tome and PrincipeSaudi ArabiaSenegalSerbiaSeychellesSierra LeoneSingaporeSlovak RepublicSloveniaSmall statesSolomon IslandsSouth AfricaSouth AsiaSouth Asia (IDA & IBRD)SpainSri LankaSt. Kitts and NevisSt. LuciaSt. Vincent and the GrenadinesSub-Saharan Africa Sub-Saharan Africa (excluding high income)Sub-Saharan Africa (IDA & IBRD countries)SudanSurinameSwazilandSwedenSwitzerlandSyrian Arab RepublicTajikistanTanzaniaThailandTimor-LesteTogoTongaTrinidad and TobagoTunisiaTurkeyTurks and Caicos IslandsTuvaluUgandaUkraineUnited Arab EmiratesUpper middle incomeUruguayUzbekistanVanuatuVenezuela, RBVietnamWest Bank and GazaWorldYemen, Rep.ZambiaZimbabwe Timeline:
This timeline shows a graph from 1977 to 2014 of Sub-Saharan Africa (IDA & IBRD countries). No data until 1976. Number of actual observations by date: 32.
Source name:
World Development Indicators
Source organization:
United Nations Educational, Scientific, and Cultural Organization (UNESCO) Institute for Statistics.
Categories, topics:
Education, Gender
Last updated:
apr 23, 2017
Indicators value changes by year
Minimum:
60.098
jan 1, 1980
Maximum:
77.882
jan 1, 2014
At the date of observation
Value
Absolute change
Change from previous value
jan 1, 1977
63.162
+63.162
0.0%
jan 1, 1978
62.712
-0.45
-0.71%
jan 1, 1979
61.39
-1.322
-2.11%
jan 1, 1980
60.098
-1.292
-2.1%
jan 1, 1981
62.032
+1.934
3.22%
jan 1, 1982
60.811
-1.221
-1.97%
jan 1, 1987
61.255
+0.444
0.73%
jan 1, 1988
62.636
+1.38
2.25%
jan 1, 1989
63.927
+1.291
2.06%
jan 1, 1990
64.741
+0.815
1.27%
jan 1, 1991
63.996
-0.746
-1.15%
jan 1, 1993
64.349
+0.354
0.55%
jan 1, 1995
65.317
+0.968
1.5%
jan 1, 1996
66.71
+1.393
2.13%
jan 1, 1997
67.874
+1.163
1.74%
jan 1, 1998
68.888
+1.015
1.49%
jan 1, 1999
70.514
+1.626
2.36%
jan 1, 2000
69.401
-1.112
-1.58%
jan 1, 2001
70.302
+0.901
1.3%
jan 1, 2002
70.593
+0.29
0.41%
jan 1, 2003
70.453
-0.14
-0.2%
jan 1, 2004
72.169
+1.717
2.44%
jan 1, 2005
73.743
+1.574
2.18%
jan 1, 2006
74.626
+0.883
1.2%
jan 1, 2007
75.521
+0.894
1.2%
jan 1, 2008
76.93
+1.41
1.87%
jan 1, 2009
75.211
-1.719
-2.23%
jan 1, 2010
76.934
+1.723
2.29%
jan 1, 2011
76.92
-0.014
-0.02%
jan 1, 2012
77.686
+0.766
1.0%
jan 1, 2013
77.628
-0.058
-0.07%
jan 1, 2014
77.882
+0.254
0.33%
Ranking of countries by current statistics by years


Comments: