29
/
en
AIzaSyAYiBZKx7MnpbEhh9jyipgxe19OcubqV5w
April 1, 2024
255750
Swaziland
SWZ
true
2
1
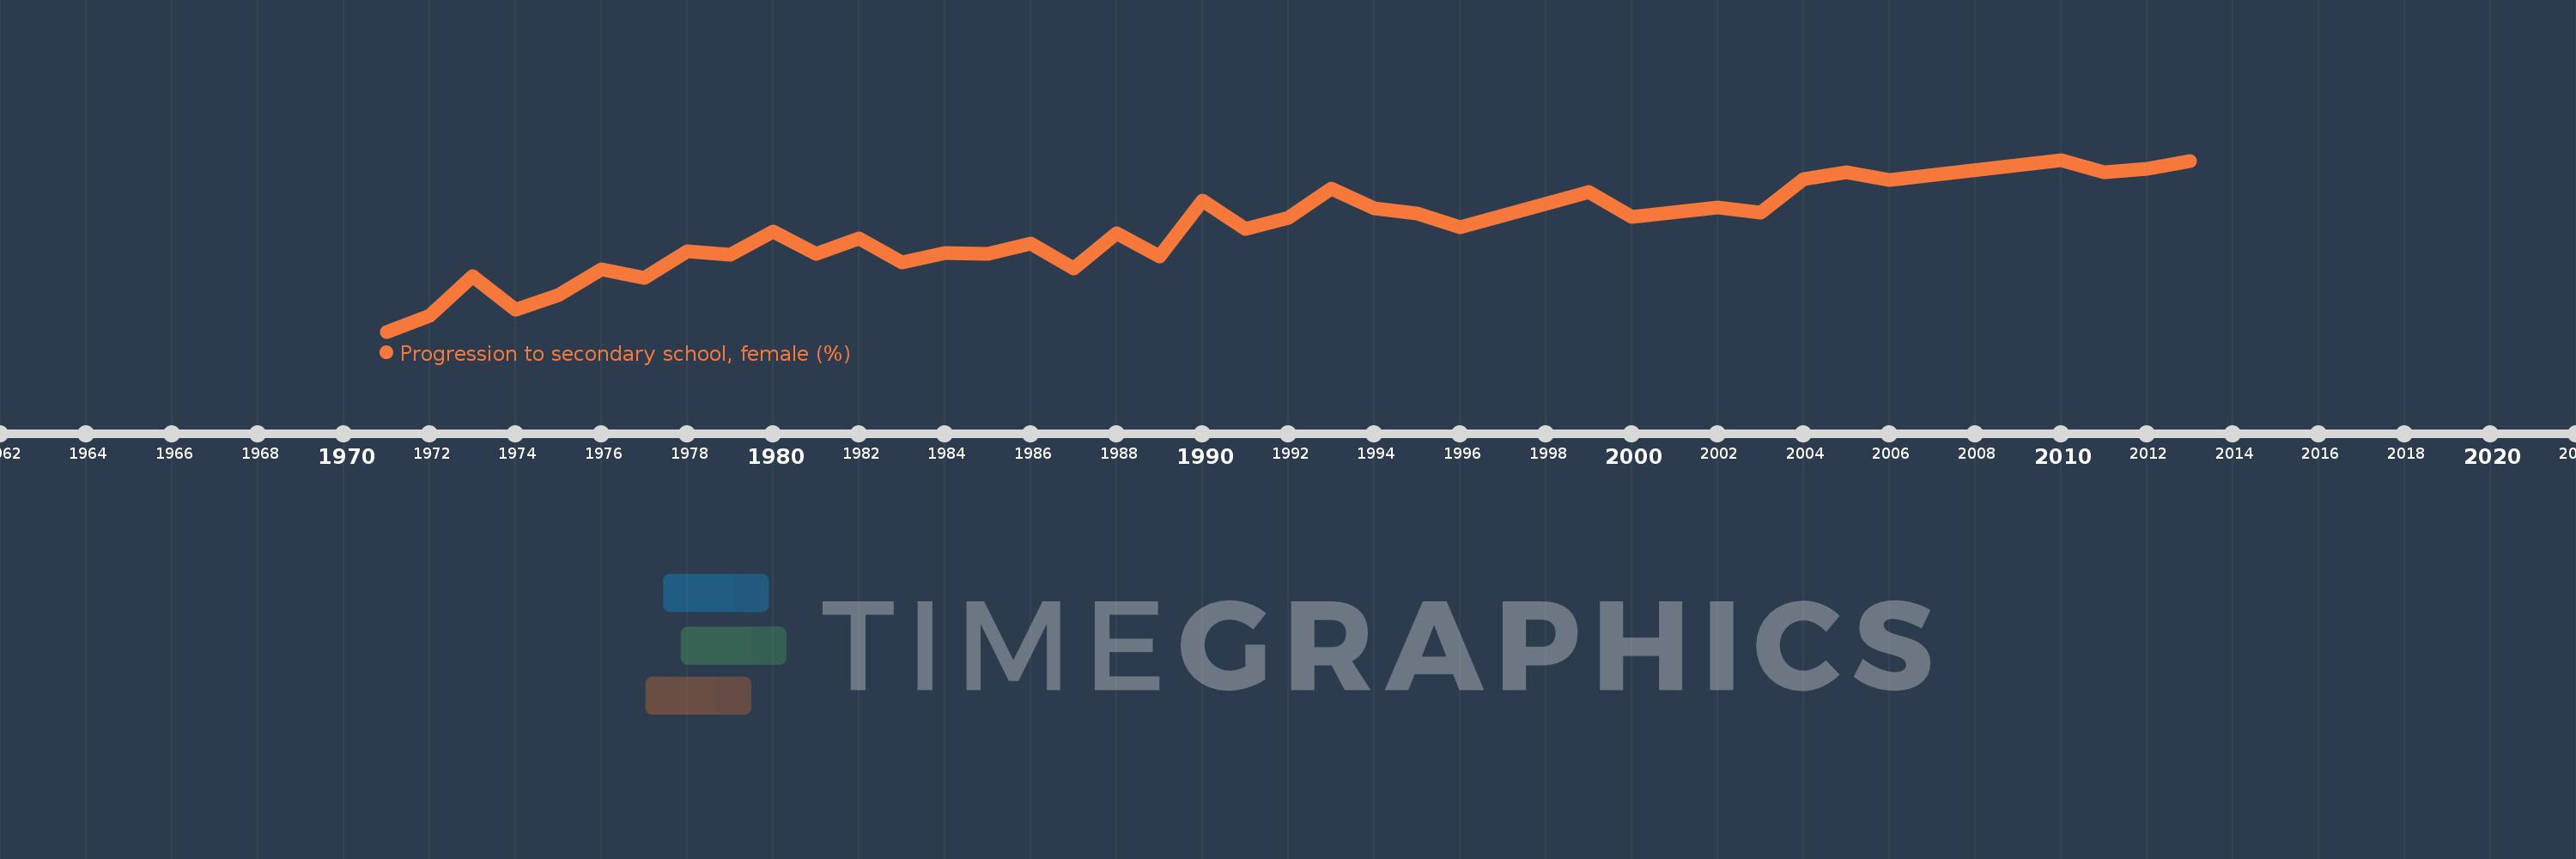
Progression to secondary school, female (%)
2013,2012,2011,2010,2006,2005,2004,2003,2002,2000,1999,1996,1995,1994,1993,1992,1991,1990,1989,1988,1987,1986,1985,1984,1983,1982,1981,1980,1979,1978,1977,1976,1975,1974,1973,1972,1971
This statistics in other country:
AfghanistanAlbaniaAlgeriaAngolaAntigua and BarbudaArab WorldArgentinaArmeniaArubaAustriaAzerbaijanBahamas, TheBahrainBarbadosBelarusBelgiumBelizeBeninBermudaBhutanBoliviaBosnia and HerzegovinaBotswanaBrazilBritish Virgin IslandsBrunei DarussalamBulgariaBurkina FasoBurundiCabo VerdeCambodiaCameroonCaribbean small statesCayman IslandsCentral African RepublicCentral Europe and the BalticsChadChileChinaColombiaComorosCongo, Dem. Rep.Congo, Rep.Costa RicaCote d'IvoireCroatiaCubaCyprusCzech RepublicDenmarkDjiboutiDominicaDominican RepublicEarly-demographic dividendEast Asia & PacificEast Asia & Pacific (excluding high income)East Asia & Pacific (IDA & IBRD countries)EcuadorEgypt, Arab Rep.El SalvadorEquatorial GuineaEritreaEstoniaEthiopiaEuro areaEurope & Central AsiaEurope & Central Asia (excluding high income)Europe & Central Asia (IDA & IBRD countries)European UnionFijiFinlandFragile and conflict affected situationsGabonGambia, TheGeorgiaGermanyGhanaGreeceGrenadaGuatemalaGuineaGuinea-BissauGuyanaHaitiHeavily indebted poor countries (HIPC)High incomeHondurasHong Kong SAR, ChinaHungaryIBRD onlyIcelandIDA & IBRD totalIDA blendIDA onlyIDA totalIndiaIndonesiaIran, Islamic Rep.IraqIsraelItalyJamaicaJapanJordanKazakhstanKenyaKiribatiKorea, Rep.KuwaitKyrgyz RepublicLao PDRLate-demographic dividendLatin America & Caribbean Latin America & Caribbean (excluding high income)Latin America & the Caribbean (IDA & IBRD countries)LatviaLeast developed countries: UN classificationLebanonLesothoLiberiaLibyaLiechtensteinLithuaniaLow & middle incomeLow incomeLower middle incomeLuxembourgMacao SAR, ChinaMacedonia, FYRMadagascarMalawiMalaysiaMaldivesMaliMaltaMarshall IslandsMauritaniaMauritiusMexicoMiddle East & North AfricaMiddle East & North Africa (excluding high income)Middle East & North Africa (IDA & IBRD countries)Middle incomeMoldovaMonacoMongoliaMoroccoMozambiqueMyanmarNamibiaNepalNetherlandsNicaraguaNigerNorwayOECD membersOmanOther small statesPacific island small statesPakistanPalauPanamaParaguayPeruPhilippinesPolandPortugalPost-demographic dividendPre-demographic dividendQatarRomaniaRussian FederationRwandaSamoaSan MarinoSao Tome and PrincipeSaudi ArabiaSenegalSerbiaSeychellesSierra LeoneSingaporeSlovak RepublicSloveniaSmall statesSolomon IslandsSouth AfricaSouth AsiaSouth Asia (IDA & IBRD)SpainSri LankaSt. Kitts and NevisSt. LuciaSt. Vincent and the GrenadinesSub-Saharan Africa Sub-Saharan Africa (excluding high income)Sub-Saharan Africa (IDA & IBRD countries)SudanSurinameSwazilandSwedenSwitzerlandSyrian Arab RepublicTajikistanTanzaniaThailandTimor-LesteTogoTongaTrinidad and TobagoTunisiaTurkeyTurks and Caicos IslandsTuvaluUgandaUkraineUnited Arab EmiratesUpper middle incomeUruguayUzbekistanVanuatuVenezuela, RBVietnamWest Bank and GazaWorldYemen, Rep.ZambiaZimbabwe Timeline:
This timeline shows a graph from 1971 to 2013 of Swaziland. No data until 1970. Number of actual observations by date: 37.
Source name:
World Development Indicators
Source organization:
United Nations Educational, Scientific, and Cultural Organization (UNESCO) Institute for Statistics.
Categories, topics:
Education, Gender
Last updated:
apr 23, 2017
Indicators value changes by year
Maximum:
98.595
jan 1, 2010
At the date of observation
Value
Absolute change
Change from previous value
jan 1, 1971
55.18
+55.18
0.0%
jan 1, 1972
59.115
+3.935
7.13%
jan 1, 1973
69.089
+9.974
16.87%
jan 1, 1974
60.754
-8.335
-12.06%
jan 1, 1975
64.414
+3.661
6.03%
jan 1, 1976
70.83
+6.416
9.96%
jan 1, 1977
68.728
-2.102
-2.97%
jan 1, 1978
75.514
+6.786
9.87%
jan 1, 1979
74.673
-0.841
-1.11%
jan 1, 1980
80.376
+5.702
7.64%
jan 1, 1981
74.726
-5.65
-7.03%
jan 1, 1982
78.824
+4.099
5.48%
jan 1, 1983
72.666
-6.158
-7.81%
jan 1, 1984
75.113
+2.447
3.37%
jan 1, 1985
74.913
-0.199
-0.27%
jan 1, 1986
77.401
+2.487
3.32%
jan 1, 1987
71.037
-6.363
-8.22%
jan 1, 1988
80.062
+9.025
12.7%
jan 1, 1989
74.241
-5.821
-7.27%
jan 1, 1990
88.279
+14.038
18.91%
jan 1, 1991
81.174
-7.105
-8.05%
jan 1, 1992
83.876
+2.702
3.33%
jan 1, 1993
91.227
+7.351
8.76%
jan 1, 1994
86.348
-4.879
-5.35%
jan 1, 1995
84.96
-1.388
-1.61%
jan 1, 1996
81.535
-3.425
-4.03%
jan 1, 1999
90.469
+8.934
10.96%
jan 1, 2000
84.081
-6.389
-7.06%
jan 1, 2002
86.506
+2.425
2.88%
jan 1, 2003
85.309
-1.197
-1.38%
jan 1, 2004
93.751
+8.443
9.9%
jan 1, 2005
95.497
+1.746
1.86%
jan 1, 2006
93.471
-2.026
-2.12%
jan 1, 2010
98.595
+5.124
5.48%
jan 1, 2011
95.535
-3.06
-3.1%
jan 1, 2012
96.228
+0.692
0.72%
jan 1, 2013
98.28
+2.053
2.13%
Ranking of countries by current statistics by years


Comments: