29
/
en
AIzaSyAYiBZKx7MnpbEhh9jyipgxe19OcubqV5w
April 1, 2024
25270
Caribbean small states
CSS
false
2
1
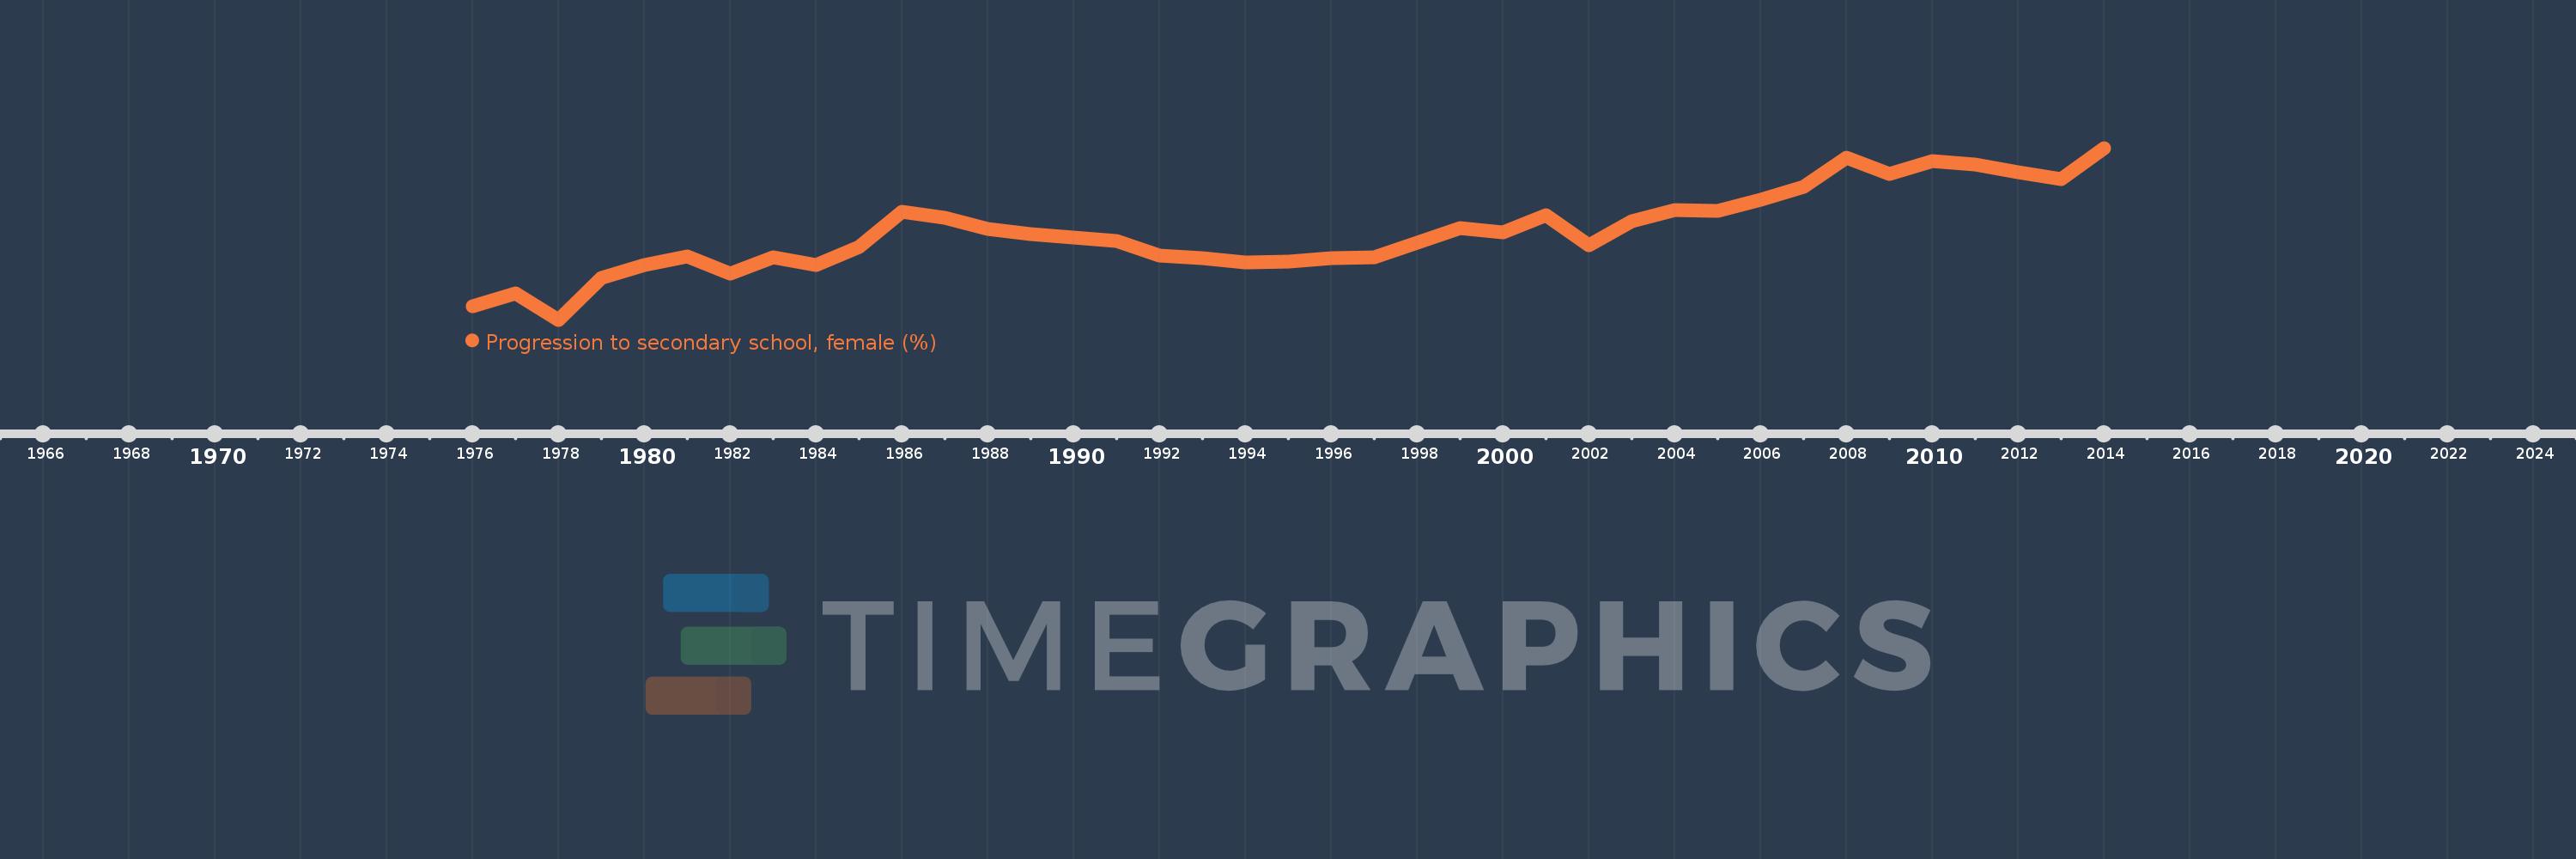
Progression to secondary school, female (%)
2014,2013,2012,2011,2010,2009,2008,2007,2006,2005,2004,2003,2002,2001,2000,1999,1998,1997,1996,1995,1994,1993,1992,1991,1990,1989,1988,1987,1986,1985,1984,1983,1982,1981,1980,1979,1978,1977,1976
This statistics in other country:
AfghanistanAlbaniaAlgeriaAngolaAntigua and BarbudaArab WorldArgentinaArmeniaArubaAustriaAzerbaijanBahamas, TheBahrainBarbadosBelarusBelgiumBelizeBeninBermudaBhutanBoliviaBosnia and HerzegovinaBotswanaBrazilBritish Virgin IslandsBrunei DarussalamBulgariaBurkina FasoBurundiCabo VerdeCambodiaCameroonCaribbean small statesCayman IslandsCentral African RepublicCentral Europe and the BalticsChadChileChinaColombiaComorosCongo, Dem. Rep.Congo, Rep.Costa RicaCote d'IvoireCroatiaCubaCyprusCzech RepublicDenmarkDjiboutiDominicaDominican RepublicEarly-demographic dividendEast Asia & PacificEast Asia & Pacific (excluding high income)East Asia & Pacific (IDA & IBRD countries)EcuadorEgypt, Arab Rep.El SalvadorEquatorial GuineaEritreaEstoniaEthiopiaEuro areaEurope & Central AsiaEurope & Central Asia (excluding high income)Europe & Central Asia (IDA & IBRD countries)European UnionFijiFinlandFragile and conflict affected situationsGabonGambia, TheGeorgiaGermanyGhanaGreeceGrenadaGuatemalaGuineaGuinea-BissauGuyanaHaitiHeavily indebted poor countries (HIPC)High incomeHondurasHong Kong SAR, ChinaHungaryIBRD onlyIcelandIDA & IBRD totalIDA blendIDA onlyIDA totalIndiaIndonesiaIran, Islamic Rep.IraqIsraelItalyJamaicaJapanJordanKazakhstanKenyaKiribatiKorea, Rep.KuwaitKyrgyz RepublicLao PDRLate-demographic dividendLatin America & Caribbean Latin America & Caribbean (excluding high income)Latin America & the Caribbean (IDA & IBRD countries)LatviaLeast developed countries: UN classificationLebanonLesothoLiberiaLibyaLiechtensteinLithuaniaLow & middle incomeLow incomeLower middle incomeLuxembourgMacao SAR, ChinaMacedonia, FYRMadagascarMalawiMalaysiaMaldivesMaliMaltaMarshall IslandsMauritaniaMauritiusMexicoMiddle East & North AfricaMiddle East & North Africa (excluding high income)Middle East & North Africa (IDA & IBRD countries)Middle incomeMoldovaMonacoMongoliaMoroccoMozambiqueMyanmarNamibiaNepalNetherlandsNicaraguaNigerNorwayOECD membersOmanOther small statesPacific island small statesPakistanPalauPanamaParaguayPeruPhilippinesPolandPortugalPost-demographic dividendPre-demographic dividendQatarRomaniaRussian FederationRwandaSamoaSan MarinoSao Tome and PrincipeSaudi ArabiaSenegalSerbiaSeychellesSierra LeoneSingaporeSlovak RepublicSloveniaSmall statesSolomon IslandsSouth AfricaSouth AsiaSouth Asia (IDA & IBRD)SpainSri LankaSt. Kitts and NevisSt. LuciaSt. Vincent and the GrenadinesSub-Saharan Africa Sub-Saharan Africa (excluding high income)Sub-Saharan Africa (IDA & IBRD countries)SudanSurinameSwazilandSwedenSwitzerlandSyrian Arab RepublicTajikistanTanzaniaThailandTimor-LesteTogoTongaTrinidad and TobagoTunisiaTurkeyTurks and Caicos IslandsTuvaluUgandaUkraineUnited Arab EmiratesUpper middle incomeUruguayUzbekistanVanuatuVenezuela, RBVietnamWest Bank and GazaWorldYemen, Rep.ZambiaZimbabwe Timeline:
This timeline shows a graph from 1976 to 2014 of Caribbean small states. No data until 1975. Number of actual observations by date: 39.
Source name:
World Development Indicators
Source organization:
United Nations Educational, Scientific, and Cultural Organization (UNESCO) Institute for Statistics.
Categories, topics:
Education, Gender
Last updated:
apr 23, 2017
Indicators value changes by year
Minimum:
80.483
jan 1, 1978
Maximum:
95.809
jan 1, 2014
At the date of observation
Value
Absolute change
Change from previous value
jan 1, 1976
81.652
+81.652
0.0%
jan 1, 1977
82.851
+1.199
1.47%
jan 1, 1978
80.483
-2.368
-2.86%
jan 1, 1979
84.183
+3.7
4.6%
jan 1, 1980
85.333
+1.151
1.37%
jan 1, 1981
86.137
+0.804
0.94%
jan 1, 1982
84.635
-1.502
-1.74%
jan 1, 1983
86.065
+1.43
1.69%
jan 1, 1984
85.334
-0.731
-0.85%
jan 1, 1985
86.944
+1.61
1.89%
jan 1, 1986
90.148
+3.204
3.68%
jan 1, 1987
89.556
-0.592
-0.66%
jan 1, 1988
88.596
-0.96
-1.07%
jan 1, 1989
88.118
-0.477
-0.54%
jan 1, 1990
87.823
-0.296
-0.34%
jan 1, 1991
87.524
-0.299
-0.34%
jan 1, 1992
86.176
-1.348
-1.54%
jan 1, 1993
86.008
-0.167
-0.19%
jan 1, 1994
85.556
-0.452
-0.53%
jan 1, 1995
85.657
+0.1
0.12%
jan 1, 1996
85.968
+0.312
0.36%
jan 1, 1997
86.032
+0.063
0.07%
jan 1, 1998
87.392
+1.36
1.58%
jan 1, 1999
88.646
+1.254
1.44%
jan 1, 2000
88.276
-0.369
-0.42%
jan 1, 2001
89.775
+1.499
1.7%
jan 1, 2002
87.148
-2.628
-2.93%
jan 1, 2003
89.257
+2.109
2.42%
jan 1, 2004
90.251
+0.994
1.11%
jan 1, 2005
90.178
-0.073
-0.08%
jan 1, 2006
91.167
+0.988
1.1%
jan 1, 2007
92.349
+1.182
1.3%
jan 1, 2008
94.973
+2.624
2.84%
jan 1, 2009
93.474
-1.499
-1.58%
jan 1, 2010
94.637
+1.163
1.24%
jan 1, 2011
94.305
-0.332
-0.35%
jan 1, 2012
93.633
-0.671
-0.71%
jan 1, 2013
93.018
-0.615
-0.66%
jan 1, 2014
95.809
+2.79
3.0%
Ranking of countries by current statistics by years


Comments: