29
/
en
AIzaSyAYiBZKx7MnpbEhh9jyipgxe19OcubqV5w
April 1, 2024
34569
Fragile and conflict affected situations
FCS
false
2
1
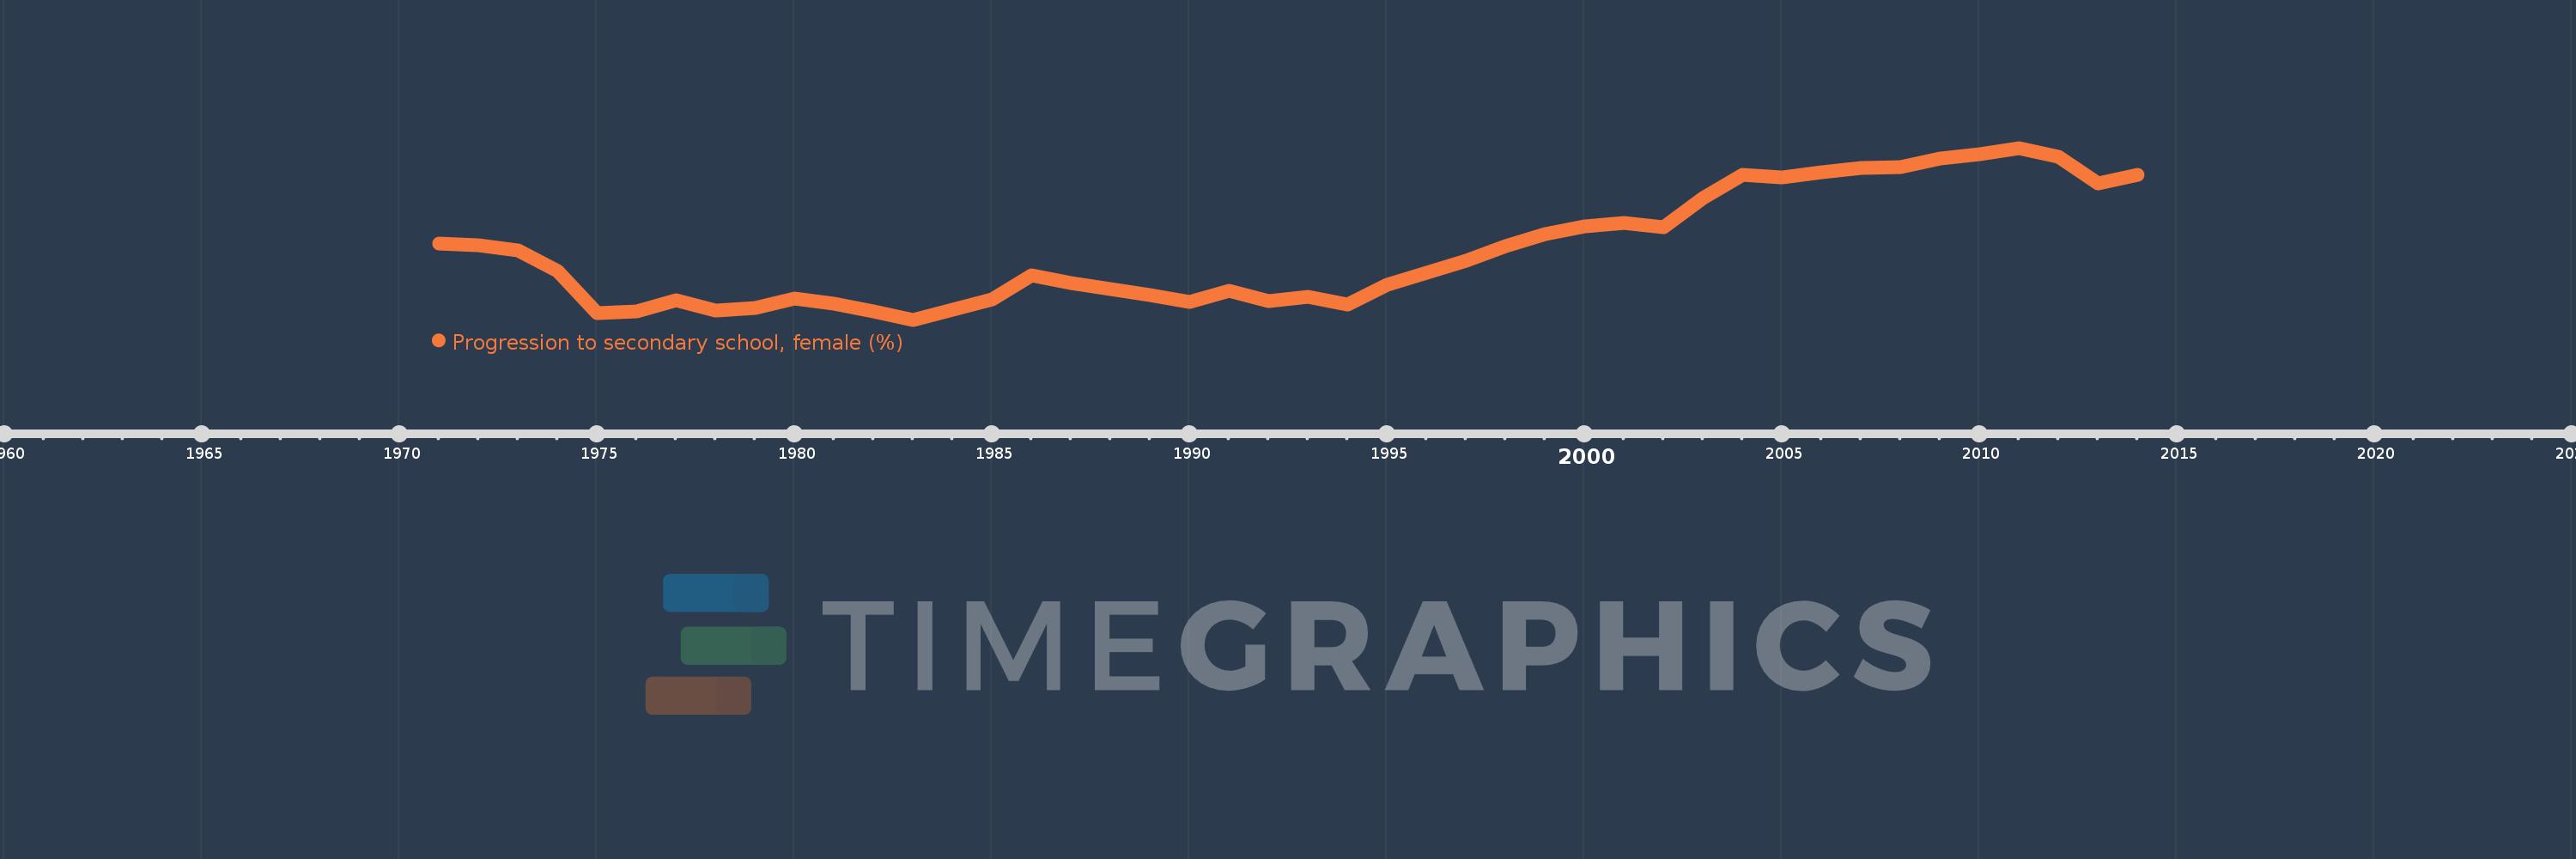
Progression to secondary school, female (%)
2014,2013,2012,2011,2010,2009,2008,2007,2006,2005,2004,2003,2002,2001,2000,1999,1998,1997,1996,1995,1994,1993,1992,1991,1990,1989,1988,1987,1986,1985,1984,1983,1982,1981,1980,1979,1978,1977,1976,1975,1974,1973,1972,1971
This statistics in other country:
AfghanistanAlbaniaAlgeriaAngolaAntigua and BarbudaArab WorldArgentinaArmeniaArubaAustriaAzerbaijanBahamas, TheBahrainBarbadosBelarusBelgiumBelizeBeninBermudaBhutanBoliviaBosnia and HerzegovinaBotswanaBrazilBritish Virgin IslandsBrunei DarussalamBulgariaBurkina FasoBurundiCabo VerdeCambodiaCameroonCaribbean small statesCayman IslandsCentral African RepublicCentral Europe and the BalticsChadChileChinaColombiaComorosCongo, Dem. Rep.Congo, Rep.Costa RicaCote d'IvoireCroatiaCubaCyprusCzech RepublicDenmarkDjiboutiDominicaDominican RepublicEarly-demographic dividendEast Asia & PacificEast Asia & Pacific (excluding high income)East Asia & Pacific (IDA & IBRD countries)EcuadorEgypt, Arab Rep.El SalvadorEquatorial GuineaEritreaEstoniaEthiopiaEuro areaEurope & Central AsiaEurope & Central Asia (excluding high income)Europe & Central Asia (IDA & IBRD countries)European UnionFijiFinlandFragile and conflict affected situationsGabonGambia, TheGeorgiaGermanyGhanaGreeceGrenadaGuatemalaGuineaGuinea-BissauGuyanaHaitiHeavily indebted poor countries (HIPC)High incomeHondurasHong Kong SAR, ChinaHungaryIBRD onlyIcelandIDA & IBRD totalIDA blendIDA onlyIDA totalIndiaIndonesiaIran, Islamic Rep.IraqIsraelItalyJamaicaJapanJordanKazakhstanKenyaKiribatiKorea, Rep.KuwaitKyrgyz RepublicLao PDRLate-demographic dividendLatin America & Caribbean Latin America & Caribbean (excluding high income)Latin America & the Caribbean (IDA & IBRD countries)LatviaLeast developed countries: UN classificationLebanonLesothoLiberiaLibyaLiechtensteinLithuaniaLow & middle incomeLow incomeLower middle incomeLuxembourgMacao SAR, ChinaMacedonia, FYRMadagascarMalawiMalaysiaMaldivesMaliMaltaMarshall IslandsMauritaniaMauritiusMexicoMiddle East & North AfricaMiddle East & North Africa (excluding high income)Middle East & North Africa (IDA & IBRD countries)Middle incomeMoldovaMonacoMongoliaMoroccoMozambiqueMyanmarNamibiaNepalNetherlandsNicaraguaNigerNorwayOECD membersOmanOther small statesPacific island small statesPakistanPalauPanamaParaguayPeruPhilippinesPolandPortugalPost-demographic dividendPre-demographic dividendQatarRomaniaRussian FederationRwandaSamoaSan MarinoSao Tome and PrincipeSaudi ArabiaSenegalSerbiaSeychellesSierra LeoneSingaporeSlovak RepublicSloveniaSmall statesSolomon IslandsSouth AfricaSouth AsiaSouth Asia (IDA & IBRD)SpainSri LankaSt. Kitts and NevisSt. LuciaSt. Vincent and the GrenadinesSub-Saharan Africa Sub-Saharan Africa (excluding high income)Sub-Saharan Africa (IDA & IBRD countries)SudanSurinameSwazilandSwedenSwitzerlandSyrian Arab RepublicTajikistanTanzaniaThailandTimor-LesteTogoTongaTrinidad and TobagoTunisiaTurkeyTurks and Caicos IslandsTuvaluUgandaUkraineUnited Arab EmiratesUpper middle incomeUruguayUzbekistanVanuatuVenezuela, RBVietnamWest Bank and GazaWorldYemen, Rep.ZambiaZimbabwe Timeline:
This timeline shows a graph from 1971 to 2014 of Fragile and conflict affected situations. No data until 1970. Number of actual observations by date: 44.
Source name:
World Development Indicators
Source organization:
United Nations Educational, Scientific, and Cultural Organization (UNESCO) Institute for Statistics.
Categories, topics:
Education, Gender
Last updated:
apr 23, 2017
Indicators value changes by year
Minimum:
61.734
jan 1, 1983
Maximum:
79.574
jan 1, 2011
At the date of observation
Value
Absolute change
Change from previous value
jan 1, 1971
69.67
+69.67
0.0%
jan 1, 1972
69.486
-0.183
-0.26%
jan 1, 1973
68.903
-0.583
-0.84%
jan 1, 1974
66.823
-2.081
-3.02%
jan 1, 1975
62.402
-4.421
-6.62%
jan 1, 1976
62.637
+0.235
0.38%
jan 1, 1977
63.716
+1.079
1.72%
jan 1, 1978
62.683
-1.034
-1.62%
jan 1, 1979
62.966
+0.283
0.45%
jan 1, 1980
63.965
+0.999
1.59%
jan 1, 1981
63.394
-0.57
-0.89%
jan 1, 1982
62.595
-0.8
-1.26%
jan 1, 1983
61.734
-0.861
-1.37%
jan 1, 1984
62.783
+1.049
1.7%
jan 1, 1985
63.812
+1.029
1.64%
jan 1, 1986
66.326
+2.514
3.94%
jan 1, 1987
65.535
-0.791
-1.19%
jan 1, 1988
64.935
-0.6
-0.92%
jan 1, 1989
64.272
-0.663
-1.02%
jan 1, 1990
63.595
-0.678
-1.05%
jan 1, 1991
64.699
+1.105
1.74%
jan 1, 1992
63.683
-1.016
-1.57%
jan 1, 1993
64.108
+0.425
0.67%
jan 1, 1994
63.332
-0.776
-1.21%
jan 1, 1995
65.328
+1.996
3.15%
jan 1, 1996
66.594
+1.266
1.94%
jan 1, 1997
67.869
+1.275
1.91%
jan 1, 1998
69.422
+1.554
2.29%
jan 1, 1999
70.617
+1.195
1.72%
jan 1, 2000
71.409
+0.792
1.12%
jan 1, 2001
71.816
+0.407
0.57%
jan 1, 2002
71.363
-0.452
-0.63%
jan 1, 2003
74.4
+3.037
4.26%
jan 1, 2004
76.759
+2.358
3.17%
jan 1, 2005
76.47
-0.289
-0.38%
jan 1, 2006
77.009
+0.539
0.71%
jan 1, 2007
77.518
+0.509
0.66%
jan 1, 2008
77.619
+0.101
0.13%
jan 1, 2009
78.464
+0.845
1.09%
jan 1, 2010
78.934
+0.47
0.6%
jan 1, 2011
79.574
+0.64
0.81%
jan 1, 2012
78.684
-0.89
-1.12%
jan 1, 2013
75.865
-2.819
-3.58%
jan 1, 2014
76.747
+0.883
1.16%
Ranking of countries by current statistics by years


Comments: