29
/
en
AIzaSyAYiBZKx7MnpbEhh9jyipgxe19OcubqV5w
April 1, 2024
66632
Algeria
DZA
true
2
1
Progression to secondary school, female (%)
2014,2013,2012,2011,2010,2008,2007,2006,2005,2004,2003,2002,2001,2000,1999,1998,1997,1996,1995,1994,1993,1992,1991,1990,1986,1985,1983,1981,1980,1979,1978,1977,1976,1975,1974,1973
This statistics in other country:
AfghanistanAlbaniaAlgeriaAngolaAntigua and BarbudaArab WorldArgentinaArmeniaArubaAustriaAzerbaijanBahamas, TheBahrainBarbadosBelarusBelgiumBelizeBeninBermudaBhutanBoliviaBosnia and HerzegovinaBotswanaBrazilBritish Virgin IslandsBrunei DarussalamBulgariaBurkina FasoBurundiCabo VerdeCambodiaCameroonCaribbean small statesCayman IslandsCentral African RepublicCentral Europe and the BalticsChadChileChinaColombiaComorosCongo, Dem. Rep.Congo, Rep.Costa RicaCote d'IvoireCroatiaCubaCyprusCzech RepublicDenmarkDjiboutiDominicaDominican RepublicEarly-demographic dividendEast Asia & PacificEast Asia & Pacific (excluding high income)East Asia & Pacific (IDA & IBRD countries)EcuadorEgypt, Arab Rep.El SalvadorEquatorial GuineaEritreaEstoniaEthiopiaEuro areaEurope & Central AsiaEurope & Central Asia (excluding high income)Europe & Central Asia (IDA & IBRD countries)European UnionFijiFinlandFragile and conflict affected situationsGabonGambia, TheGeorgiaGermanyGhanaGreeceGrenadaGuatemalaGuineaGuinea-BissauGuyanaHaitiHeavily indebted poor countries (HIPC)High incomeHondurasHong Kong SAR, ChinaHungaryIBRD onlyIcelandIDA & IBRD totalIDA blendIDA onlyIDA totalIndiaIndonesiaIran, Islamic Rep.IraqIsraelItalyJamaicaJapanJordanKazakhstanKenyaKiribatiKorea, Rep.KuwaitKyrgyz RepublicLao PDRLate-demographic dividendLatin America & Caribbean Latin America & Caribbean (excluding high income)Latin America & the Caribbean (IDA & IBRD countries)LatviaLeast developed countries: UN classificationLebanonLesothoLiberiaLibyaLiechtensteinLithuaniaLow & middle incomeLow incomeLower middle incomeLuxembourgMacao SAR, ChinaMacedonia, FYRMadagascarMalawiMalaysiaMaldivesMaliMaltaMarshall IslandsMauritaniaMauritiusMexicoMiddle East & North AfricaMiddle East & North Africa (excluding high income)Middle East & North Africa (IDA & IBRD countries)Middle incomeMoldovaMonacoMongoliaMoroccoMozambiqueMyanmarNamibiaNepalNetherlandsNicaraguaNigerNorwayOECD membersOmanOther small statesPacific island small statesPakistanPalauPanamaParaguayPeruPhilippinesPolandPortugalPost-demographic dividendPre-demographic dividendQatarRomaniaRussian FederationRwandaSamoaSan MarinoSao Tome and PrincipeSaudi ArabiaSenegalSerbiaSeychellesSierra LeoneSingaporeSlovak RepublicSloveniaSmall statesSolomon IslandsSouth AfricaSouth AsiaSouth Asia (IDA & IBRD)SpainSri LankaSt. Kitts and NevisSt. LuciaSt. Vincent and the GrenadinesSub-Saharan Africa Sub-Saharan Africa (excluding high income)Sub-Saharan Africa (IDA & IBRD countries)SudanSurinameSwazilandSwedenSwitzerlandSyrian Arab RepublicTajikistanTanzaniaThailandTimor-LesteTogoTongaTrinidad and TobagoTunisiaTurkeyTurks and Caicos IslandsTuvaluUgandaUkraineUnited Arab EmiratesUpper middle incomeUruguayUzbekistanVanuatuVenezuela, RBVietnamWest Bank and GazaWorldYemen, Rep.ZambiaZimbabwe Timeline:
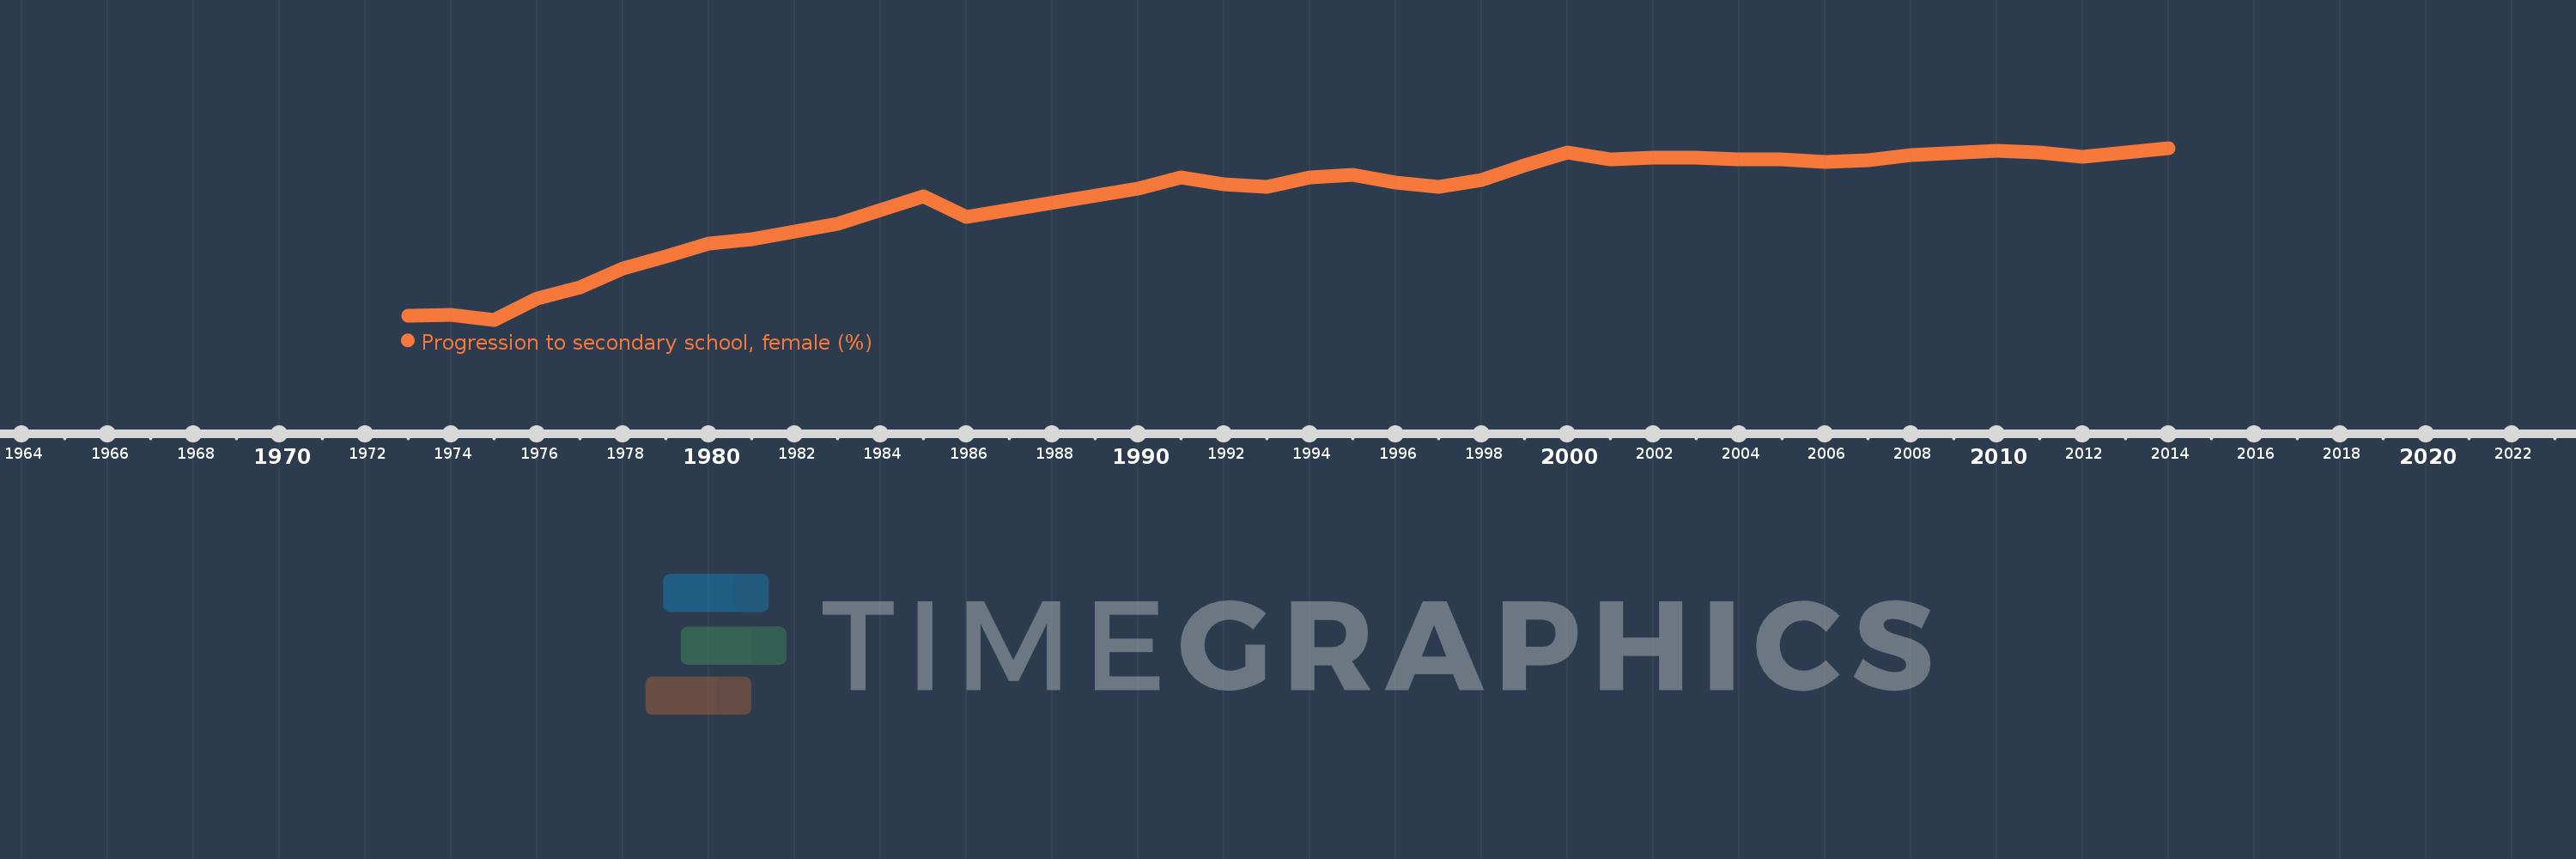
This timeline shows a graph from 1973 to 2014 of Algeria. No data until 1972. Number of actual observations by date: 36.
Source name:
World Development Indicators
Source organization:
United Nations Educational, Scientific, and Cultural Organization (UNESCO) Institute for Statistics.
Categories, topics:
Education, Gender
Last updated:
apr 23, 2017
Indicators value changes by year
Minimum:
30.038
jan 1, 1975
Maximum:
98.757
jan 1, 2014
At the date of observation
Value
Absolute change
Change from previous value
jan 1, 1973
31.67
+31.67
0.0%
jan 1, 1974
32.077
+0.407
1.28%
jan 1, 1975
30.038
-2.039
-6.36%
jan 1, 1976
38.666
+8.629
28.73%
jan 1, 1977
43.091
+4.424
11.44%
jan 1, 1978
50.411
+7.32
16.99%
jan 1, 1979
55.447
+5.036
9.99%
jan 1, 1980
60.594
+5.147
9.28%
jan 1, 1981
62.184
+1.59
2.62%
jan 1, 1983
68.455
+6.271
10.08%
jan 1, 1985
79.318
+10.863
15.87%
jan 1, 1986
71.051
-8.267
-10.42%
jan 1, 1990
82.602
+11.551
16.26%
jan 1, 1991
86.928
+4.326
5.24%
jan 1, 1992
84.096
-2.832
-3.26%
jan 1, 1993
83.14
-0.956
-1.14%
jan 1, 1994
86.89
+3.75
4.51%
jan 1, 1995
87.967
+1.077
1.24%
jan 1, 1996
85.004
-2.964
-3.37%
jan 1, 1997
83.254
-1.75
-2.06%
jan 1, 1998
85.805
+2.551
3.06%
jan 1, 1999
91.65
+5.845
6.81%
jan 1, 2000
96.781
+5.131
5.6%
jan 1, 2001
94.12
-2.66
-2.75%
jan 1, 2002
94.824
+0.704
0.75%
jan 1, 2003
94.736
-0.088
-0.09%
jan 1, 2004
94.29
-0.447
-0.47%
jan 1, 2005
94.299
+0.009
0.01%
jan 1, 2006
93.122
-1.176
-1.25%
jan 1, 2007
93.973
+0.85
0.91%
jan 1, 2008
95.99
+2.017
2.15%
jan 1, 2010
97.792
+1.802
1.88%
jan 1, 2011
97.062
-0.729
-0.75%
jan 1, 2012
95.324
-1.738
-1.79%
jan 1, 2013
96.96
+1.636
1.72%
jan 1, 2014
98.757
+1.797
1.85%
Ranking of countries by current statistics by years


Comments: