29
/
en
AIzaSyAYiBZKx7MnpbEhh9jyipgxe19OcubqV5w
April 1, 2024
46618
Low income
LIC
false
2
1
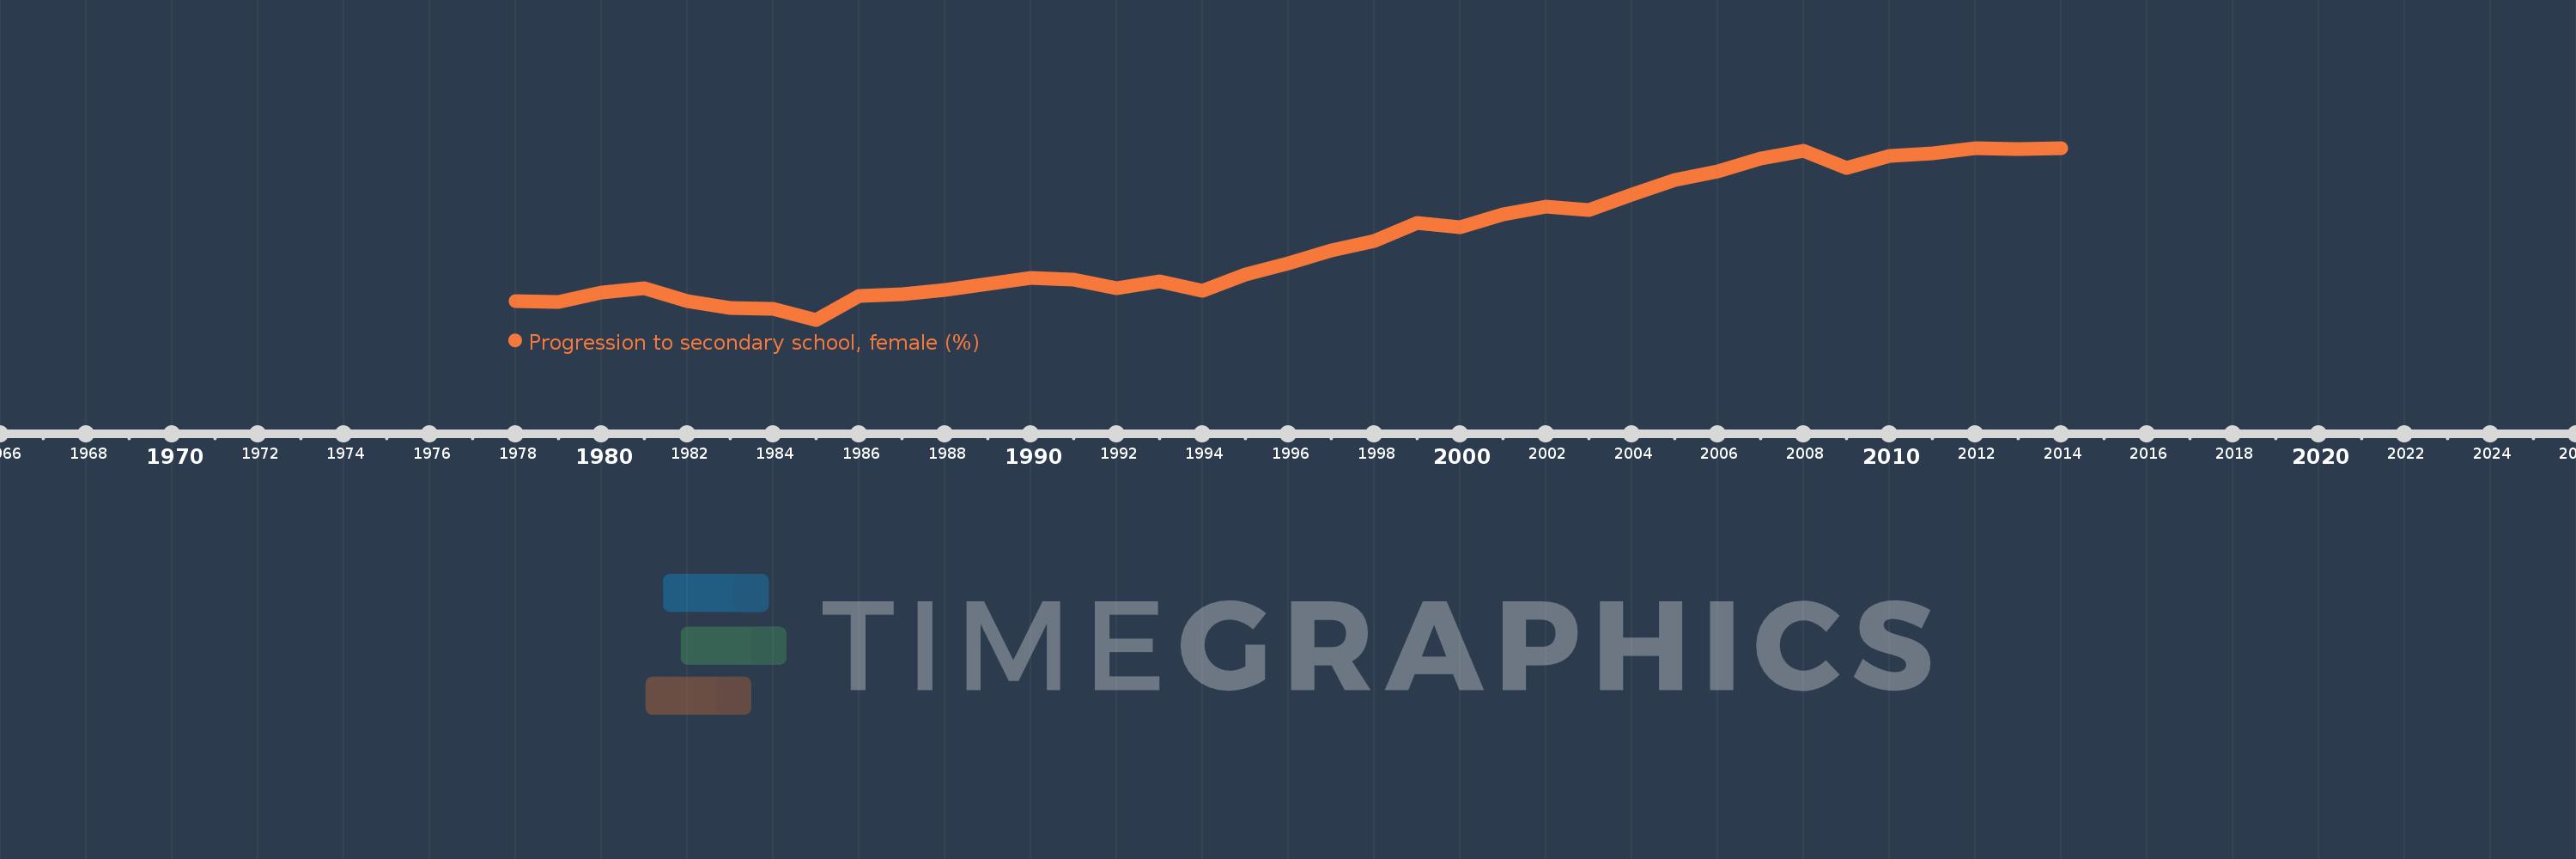
Progression to secondary school, female (%)
2014,2013,2012,2011,2010,2009,2008,2007,2006,2005,2004,2003,2002,2001,2000,1999,1998,1997,1996,1995,1994,1993,1992,1991,1990,1989,1988,1987,1986,1985,1984,1983,1982,1981,1980,1979,1978
This statistics in other country:
AfghanistanAlbaniaAlgeriaAngolaAntigua and BarbudaArab WorldArgentinaArmeniaArubaAustriaAzerbaijanBahamas, TheBahrainBarbadosBelarusBelgiumBelizeBeninBermudaBhutanBoliviaBosnia and HerzegovinaBotswanaBrazilBritish Virgin IslandsBrunei DarussalamBulgariaBurkina FasoBurundiCabo VerdeCambodiaCameroonCaribbean small statesCayman IslandsCentral African RepublicCentral Europe and the BalticsChadChileChinaColombiaComorosCongo, Dem. Rep.Congo, Rep.Costa RicaCote d'IvoireCroatiaCubaCyprusCzech RepublicDenmarkDjiboutiDominicaDominican RepublicEarly-demographic dividendEast Asia & PacificEast Asia & Pacific (excluding high income)East Asia & Pacific (IDA & IBRD countries)EcuadorEgypt, Arab Rep.El SalvadorEquatorial GuineaEritreaEstoniaEthiopiaEuro areaEurope & Central AsiaEurope & Central Asia (excluding high income)Europe & Central Asia (IDA & IBRD countries)European UnionFijiFinlandFragile and conflict affected situationsGabonGambia, TheGeorgiaGermanyGhanaGreeceGrenadaGuatemalaGuineaGuinea-BissauGuyanaHaitiHeavily indebted poor countries (HIPC)High incomeHondurasHong Kong SAR, ChinaHungaryIBRD onlyIcelandIDA & IBRD totalIDA blendIDA onlyIDA totalIndiaIndonesiaIran, Islamic Rep.IraqIsraelItalyJamaicaJapanJordanKazakhstanKenyaKiribatiKorea, Rep.KuwaitKyrgyz RepublicLao PDRLate-demographic dividendLatin America & Caribbean Latin America & Caribbean (excluding high income)Latin America & the Caribbean (IDA & IBRD countries)LatviaLeast developed countries: UN classificationLebanonLesothoLiberiaLibyaLiechtensteinLithuaniaLow & middle incomeLow incomeLower middle incomeLuxembourgMacao SAR, ChinaMacedonia, FYRMadagascarMalawiMalaysiaMaldivesMaliMaltaMarshall IslandsMauritaniaMauritiusMexicoMiddle East & North AfricaMiddle East & North Africa (excluding high income)Middle East & North Africa (IDA & IBRD countries)Middle incomeMoldovaMonacoMongoliaMoroccoMozambiqueMyanmarNamibiaNepalNetherlandsNicaraguaNigerNorwayOECD membersOmanOther small statesPacific island small statesPakistanPalauPanamaParaguayPeruPhilippinesPolandPortugalPost-demographic dividendPre-demographic dividendQatarRomaniaRussian FederationRwandaSamoaSan MarinoSao Tome and PrincipeSaudi ArabiaSenegalSerbiaSeychellesSierra LeoneSingaporeSlovak RepublicSloveniaSmall statesSolomon IslandsSouth AfricaSouth AsiaSouth Asia (IDA & IBRD)SpainSri LankaSt. Kitts and NevisSt. LuciaSt. Vincent and the GrenadinesSub-Saharan Africa Sub-Saharan Africa (excluding high income)Sub-Saharan Africa (IDA & IBRD countries)SudanSurinameSwazilandSwedenSwitzerlandSyrian Arab RepublicTajikistanTanzaniaThailandTimor-LesteTogoTongaTrinidad and TobagoTunisiaTurkeyTurks and Caicos IslandsTuvaluUgandaUkraineUnited Arab EmiratesUpper middle incomeUruguayUzbekistanVanuatuVenezuela, RBVietnamWest Bank and GazaWorldYemen, Rep.ZambiaZimbabwe Timeline:
This timeline shows a graph from 1978 to 2014 of Low income. No data until 1977. Number of actual observations by date: 37.
Source name:
World Development Indicators
Source organization:
United Nations Educational, Scientific, and Cultural Organization (UNESCO) Institute for Statistics.
Categories, topics:
Education, Gender
Last updated:
apr 23, 2017
Indicators value changes by year
Minimum:
50.046
jan 1, 1985
Maximum:
75.902
jan 1, 2012
At the date of observation
Value
Absolute change
Change from previous value
jan 1, 1978
52.801
+52.801
0.0%
jan 1, 1979
52.747
-0.054
-0.1%
jan 1, 1980
54.197
+1.45
2.75%
jan 1, 1981
54.837
+0.64
1.18%
jan 1, 1982
52.807
-2.03
-3.7%
jan 1, 1983
51.869
-0.938
-1.78%
jan 1, 1984
51.685
-0.184
-0.35%
jan 1, 1985
50.046
-1.639
-3.17%
jan 1, 1986
53.645
+3.6
7.19%
jan 1, 1987
53.894
+0.249
0.46%
jan 1, 1988
54.488
+0.594
1.1%
jan 1, 1989
55.5
+1.012
1.86%
jan 1, 1990
56.317
+0.816
1.47%
jan 1, 1991
56.03
-0.287
-0.51%
jan 1, 1992
54.842
-1.188
-2.12%
jan 1, 1993
55.83
+0.988
1.8%
jan 1, 1994
54.362
-1.468
-2.63%
jan 1, 1995
56.9
+2.538
4.67%
jan 1, 1996
58.577
+1.678
2.95%
jan 1, 1997
60.511
+1.934
3.3%
jan 1, 1998
61.939
+1.428
2.36%
jan 1, 1999
64.678
+2.739
4.42%
jan 1, 2000
63.958
-0.721
-1.11%
jan 1, 2001
65.915
+1.957
3.06%
jan 1, 2002
67.055
+1.14
1.73%
jan 1, 2003
66.584
-0.472
-0.7%
jan 1, 2004
68.929
+2.345
3.52%
jan 1, 2005
71.049
+2.12
3.08%
jan 1, 2006
72.402
+1.353
1.9%
jan 1, 2007
74.305
+1.903
2.63%
jan 1, 2008
75.486
+1.18
1.59%
jan 1, 2009
72.839
-2.647
-3.51%
jan 1, 2010
74.641
+1.802
2.47%
jan 1, 2011
75.039
+0.398
0.53%
jan 1, 2012
75.902
+0.863
1.15%
jan 1, 2013
75.682
-0.219
-0.29%
jan 1, 2014
75.829
+0.147
0.19%
Ranking of countries by current statistics by years


Comments: