29
/
en
AIzaSyAYiBZKx7MnpbEhh9jyipgxe19OcubqV5w
April 1, 2024
43821
Latin America & the Caribbean (IDA & IBRD countries)
TLA
false
2
1
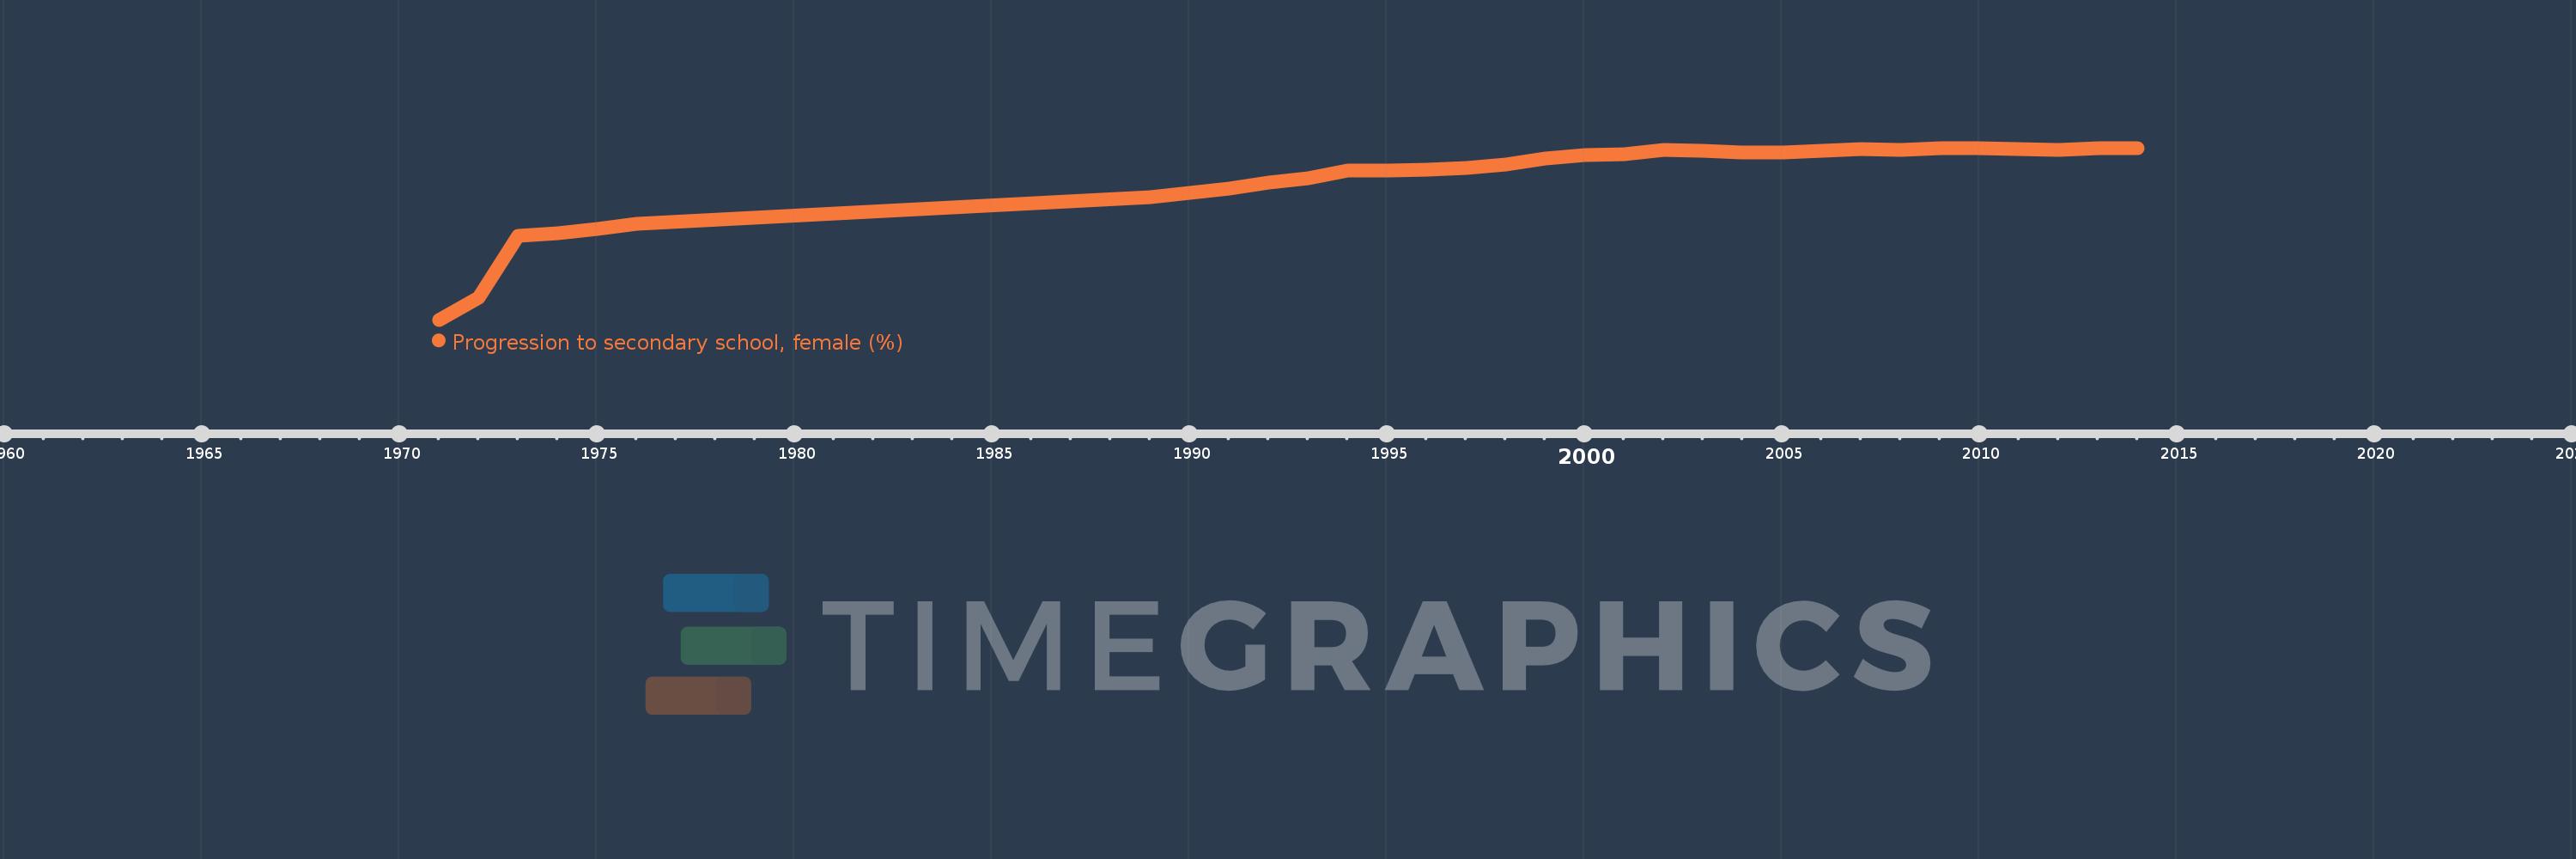
Progression to secondary school, female (%)
2014,2013,2012,2011,2010,2009,2008,2007,2006,2005,2004,2003,2002,2001,2000,1999,1998,1997,1996,1995,1994,1993,1992,1991,1989,1976,1975,1974,1973,1972,1971
This statistics in other country:
AfghanistanAlbaniaAlgeriaAngolaAntigua and BarbudaArab WorldArgentinaArmeniaArubaAustriaAzerbaijanBahamas, TheBahrainBarbadosBelarusBelgiumBelizeBeninBermudaBhutanBoliviaBosnia and HerzegovinaBotswanaBrazilBritish Virgin IslandsBrunei DarussalamBulgariaBurkina FasoBurundiCabo VerdeCambodiaCameroonCaribbean small statesCayman IslandsCentral African RepublicCentral Europe and the BalticsChadChileChinaColombiaComorosCongo, Dem. Rep.Congo, Rep.Costa RicaCote d'IvoireCroatiaCubaCyprusCzech RepublicDenmarkDjiboutiDominicaDominican RepublicEarly-demographic dividendEast Asia & PacificEast Asia & Pacific (excluding high income)East Asia & Pacific (IDA & IBRD countries)EcuadorEgypt, Arab Rep.El SalvadorEquatorial GuineaEritreaEstoniaEthiopiaEuro areaEurope & Central AsiaEurope & Central Asia (excluding high income)Europe & Central Asia (IDA & IBRD countries)European UnionFijiFinlandFragile and conflict affected situationsGabonGambia, TheGeorgiaGermanyGhanaGreeceGrenadaGuatemalaGuineaGuinea-BissauGuyanaHaitiHeavily indebted poor countries (HIPC)High incomeHondurasHong Kong SAR, ChinaHungaryIBRD onlyIcelandIDA & IBRD totalIDA blendIDA onlyIDA totalIndiaIndonesiaIran, Islamic Rep.IraqIsraelItalyJamaicaJapanJordanKazakhstanKenyaKiribatiKorea, Rep.KuwaitKyrgyz RepublicLao PDRLate-demographic dividendLatin America & Caribbean Latin America & Caribbean (excluding high income)Latin America & the Caribbean (IDA & IBRD countries)LatviaLeast developed countries: UN classificationLebanonLesothoLiberiaLibyaLiechtensteinLithuaniaLow & middle incomeLow incomeLower middle incomeLuxembourgMacao SAR, ChinaMacedonia, FYRMadagascarMalawiMalaysiaMaldivesMaliMaltaMarshall IslandsMauritaniaMauritiusMexicoMiddle East & North AfricaMiddle East & North Africa (excluding high income)Middle East & North Africa (IDA & IBRD countries)Middle incomeMoldovaMonacoMongoliaMoroccoMozambiqueMyanmarNamibiaNepalNetherlandsNicaraguaNigerNorwayOECD membersOmanOther small statesPacific island small statesPakistanPalauPanamaParaguayPeruPhilippinesPolandPortugalPost-demographic dividendPre-demographic dividendQatarRomaniaRussian FederationRwandaSamoaSan MarinoSao Tome and PrincipeSaudi ArabiaSenegalSerbiaSeychellesSierra LeoneSingaporeSlovak RepublicSloveniaSmall statesSolomon IslandsSouth AfricaSouth AsiaSouth Asia (IDA & IBRD)SpainSri LankaSt. Kitts and NevisSt. LuciaSt. Vincent and the GrenadinesSub-Saharan Africa Sub-Saharan Africa (excluding high income)Sub-Saharan Africa (IDA & IBRD countries)SudanSurinameSwazilandSwedenSwitzerlandSyrian Arab RepublicTajikistanTanzaniaThailandTimor-LesteTogoTongaTrinidad and TobagoTunisiaTurkeyTurks and Caicos IslandsTuvaluUgandaUkraineUnited Arab EmiratesUpper middle incomeUruguayUzbekistanVanuatuVenezuela, RBVietnamWest Bank and GazaWorldYemen, Rep.ZambiaZimbabwe Timeline:
This timeline shows a graph from 1971 to 2014 of Latin America & the Caribbean (IDA & IBRD countries). No data until 1970. Number of actual observations by date: 31.
Source name:
World Development Indicators
Source organization:
United Nations Educational, Scientific, and Cultural Organization (UNESCO) Institute for Statistics.
Categories, topics:
Education, Gender
Last updated:
apr 23, 2017
Indicators value changes by year
Maximum:
94.082
jan 1, 2009
At the date of observation
Value
Absolute change
Change from previous value
jan 1, 1971
52.87
+52.87
0.0%
jan 1, 1972
58.217
+5.346
10.11%
jan 1, 1973
73.031
+14.814
25.45%
jan 1, 1974
73.645
+0.614
0.84%
jan 1, 1975
74.711
+1.066
1.45%
jan 1, 1976
75.984
+1.273
1.7%
jan 1, 1989
82.321
+6.337
8.34%
jan 1, 1991
84.395
+2.074
2.52%
jan 1, 1992
85.719
+1.324
1.57%
jan 1, 1993
86.741
+1.021
1.19%
jan 1, 1994
88.578
+1.838
2.12%
jan 1, 1995
88.588
+0.009
0.01%
jan 1, 1996
88.922
+0.334
0.38%
jan 1, 1997
89.307
+0.385
0.43%
jan 1, 1998
90.063
+0.756
0.85%
jan 1, 1999
91.486
+1.422
1.58%
jan 1, 2000
92.357
+0.871
0.95%
jan 1, 2001
92.534
+0.177
0.19%
jan 1, 2002
93.598
+1.064
1.15%
jan 1, 2003
93.366
-0.232
-0.25%
jan 1, 2004
93.001
-0.364
-0.39%
jan 1, 2005
93.091
+0.09
0.1%
jan 1, 2006
93.365
+0.274
0.29%
jan 1, 2007
93.806
+0.441
0.47%
jan 1, 2008
93.639
-0.167
-0.18%
jan 1, 2009
94.082
+0.443
0.47%
jan 1, 2010
93.951
-0.131
-0.14%
jan 1, 2011
93.855
-0.096
-0.1%
jan 1, 2012
93.559
-0.296
-0.31%
jan 1, 2013
93.938
+0.379
0.41%
jan 1, 2014
94.049
+0.111
0.12%
Ranking of countries by current statistics by years


Comments: