29
/
en
AIzaSyAYiBZKx7MnpbEhh9jyipgxe19OcubqV5w
April 1, 2024
48501
Middle East & North Africa
MEA
false
2
1
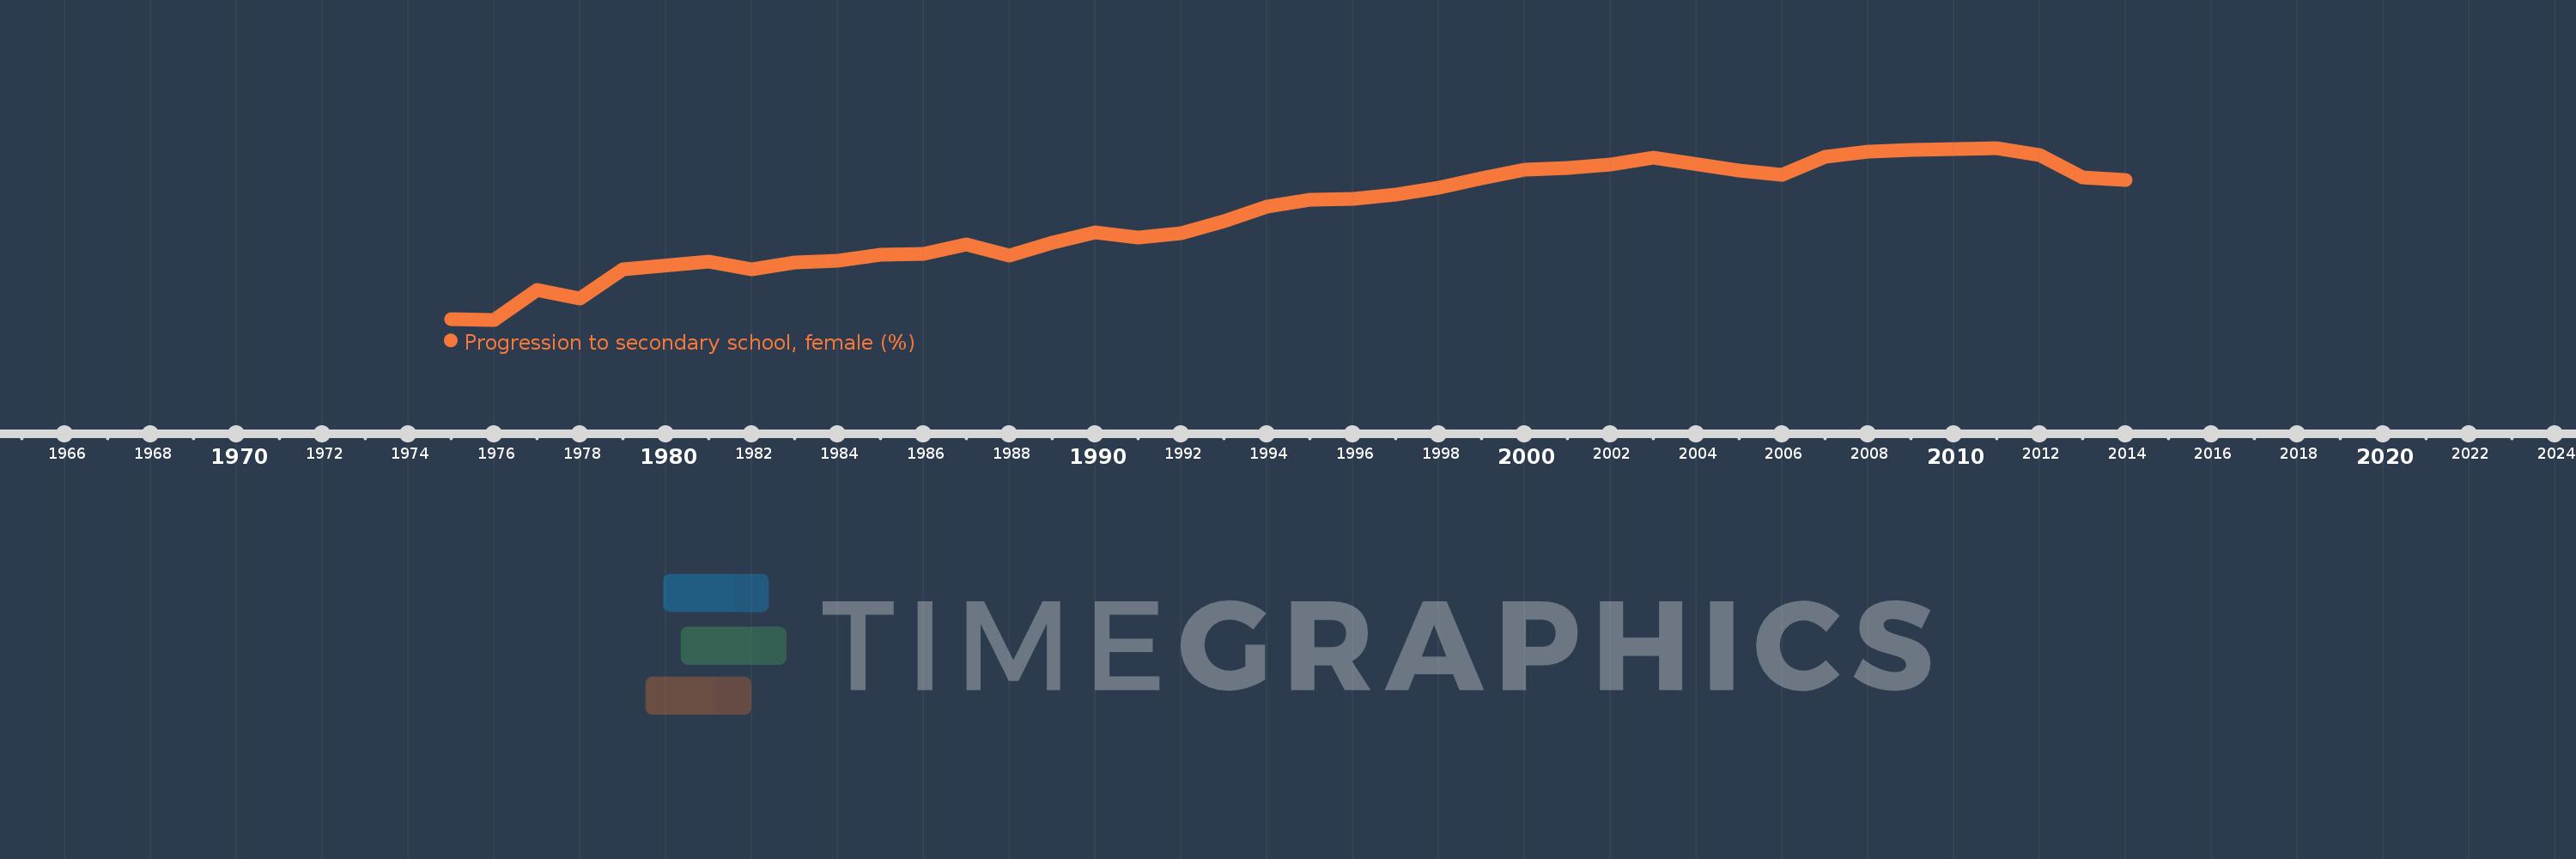
Progression to secondary school, female (%)
2014,2013,2012,2011,2010,2009,2008,2007,2006,2005,2003,2002,2001,2000,1999,1998,1997,1996,1995,1994,1993,1992,1991,1990,1989,1988,1987,1986,1985,1984,1983,1982,1981,1979,1978,1977,1976,1975
This statistics in other country:
AfghanistanAlbaniaAlgeriaAngolaAntigua and BarbudaArab WorldArgentinaArmeniaArubaAustriaAzerbaijanBahamas, TheBahrainBarbadosBelarusBelgiumBelizeBeninBermudaBhutanBoliviaBosnia and HerzegovinaBotswanaBrazilBritish Virgin IslandsBrunei DarussalamBulgariaBurkina FasoBurundiCabo VerdeCambodiaCameroonCaribbean small statesCayman IslandsCentral African RepublicCentral Europe and the BalticsChadChileChinaColombiaComorosCongo, Dem. Rep.Congo, Rep.Costa RicaCote d'IvoireCroatiaCubaCyprusCzech RepublicDenmarkDjiboutiDominicaDominican RepublicEarly-demographic dividendEast Asia & PacificEast Asia & Pacific (excluding high income)East Asia & Pacific (IDA & IBRD countries)EcuadorEgypt, Arab Rep.El SalvadorEquatorial GuineaEritreaEstoniaEthiopiaEuro areaEurope & Central AsiaEurope & Central Asia (excluding high income)Europe & Central Asia (IDA & IBRD countries)European UnionFijiFinlandFragile and conflict affected situationsGabonGambia, TheGeorgiaGermanyGhanaGreeceGrenadaGuatemalaGuineaGuinea-BissauGuyanaHaitiHeavily indebted poor countries (HIPC)High incomeHondurasHong Kong SAR, ChinaHungaryIBRD onlyIcelandIDA & IBRD totalIDA blendIDA onlyIDA totalIndiaIndonesiaIran, Islamic Rep.IraqIsraelItalyJamaicaJapanJordanKazakhstanKenyaKiribatiKorea, Rep.KuwaitKyrgyz RepublicLao PDRLate-demographic dividendLatin America & Caribbean Latin America & Caribbean (excluding high income)Latin America & the Caribbean (IDA & IBRD countries)LatviaLeast developed countries: UN classificationLebanonLesothoLiberiaLibyaLiechtensteinLithuaniaLow & middle incomeLow incomeLower middle incomeLuxembourgMacao SAR, ChinaMacedonia, FYRMadagascarMalawiMalaysiaMaldivesMaliMaltaMarshall IslandsMauritaniaMauritiusMexicoMiddle East & North AfricaMiddle East & North Africa (excluding high income)Middle East & North Africa (IDA & IBRD countries)Middle incomeMoldovaMonacoMongoliaMoroccoMozambiqueMyanmarNamibiaNepalNetherlandsNicaraguaNigerNorwayOECD membersOmanOther small statesPacific island small statesPakistanPalauPanamaParaguayPeruPhilippinesPolandPortugalPost-demographic dividendPre-demographic dividendQatarRomaniaRussian FederationRwandaSamoaSan MarinoSao Tome and PrincipeSaudi ArabiaSenegalSerbiaSeychellesSierra LeoneSingaporeSlovak RepublicSloveniaSmall statesSolomon IslandsSouth AfricaSouth AsiaSouth Asia (IDA & IBRD)SpainSri LankaSt. Kitts and NevisSt. LuciaSt. Vincent and the GrenadinesSub-Saharan Africa Sub-Saharan Africa (excluding high income)Sub-Saharan Africa (IDA & IBRD countries)SudanSurinameSwazilandSwedenSwitzerlandSyrian Arab RepublicTajikistanTanzaniaThailandTimor-LesteTogoTongaTrinidad and TobagoTunisiaTurkeyTurks and Caicos IslandsTuvaluUgandaUkraineUnited Arab EmiratesUpper middle incomeUruguayUzbekistanVanuatuVenezuela, RBVietnamWest Bank and GazaWorldYemen, Rep.ZambiaZimbabwe Timeline:
This timeline shows a graph from 1975 to 2014 of Middle East & North Africa. No data until 1974. Number of actual observations by date: 38.
Source name:
World Development Indicators
Source organization:
United Nations Educational, Scientific, and Cultural Organization (UNESCO) Institute for Statistics.
Categories, topics:
Education, Gender
Last updated:
apr 23, 2017
Indicators value changes by year
Maximum:
94.091
jan 1, 2011
At the date of observation
Value
Absolute change
Change from previous value
jan 1, 1975
65.562
+65.562
0.0%
jan 1, 1976
65.46
-0.102
-0.16%
jan 1, 1977
70.393
+4.934
7.54%
jan 1, 1978
69.04
-1.354
-1.92%
jan 1, 1979
73.815
+4.776
6.92%
jan 1, 1981
75.097
+1.281
1.74%
jan 1, 1982
73.823
-1.274
-1.7%
jan 1, 1983
74.969
+1.146
1.55%
jan 1, 1984
75.269
+0.301
0.4%
jan 1, 1985
76.364
+1.095
1.46%
jan 1, 1986
76.46
+0.096
0.13%
jan 1, 1987
78.04
+1.58
2.07%
jan 1, 1988
76.142
-1.899
-2.43%
jan 1, 1989
78.264
+2.122
2.79%
jan 1, 1990
80.035
+1.771
2.26%
jan 1, 1991
79.144
-0.891
-1.11%
jan 1, 1992
79.862
+0.717
0.91%
jan 1, 1993
81.876
+2.014
2.52%
jan 1, 1994
84.328
+2.452
2.99%
jan 1, 1995
85.432
+1.104
1.31%
jan 1, 1996
85.656
+0.224
0.26%
jan 1, 1997
86.338
+0.683
0.8%
jan 1, 1998
87.433
+1.094
1.27%
jan 1, 1999
89.103
+1.671
1.91%
jan 1, 2000
90.447
+1.344
1.51%
jan 1, 2001
90.761
+0.315
0.35%
jan 1, 2002
91.355
+0.593
0.65%
jan 1, 2003
92.492
+1.137
1.24%
jan 1, 2005
90.363
-2.129
-2.3%
jan 1, 2006
89.611
-0.752
-0.83%
jan 1, 2007
92.611
+3.0
3.35%
jan 1, 2008
93.477
+0.866
0.94%
jan 1, 2009
93.812
+0.336
0.36%
jan 1, 2010
93.868
+0.056
0.06%
jan 1, 2011
94.091
+0.223
0.24%
jan 1, 2012
92.946
-1.145
-1.22%
jan 1, 2013
89.223
-3.723
-4.01%
jan 1, 2014
88.815
-0.408
-0.46%
Ranking of countries by current statistics by years


Comments: