29
/
en
AIzaSyAYiBZKx7MnpbEhh9jyipgxe19OcubqV5w
April 1, 2024
55837
Pre-demographic dividend
PRE
false
2
1
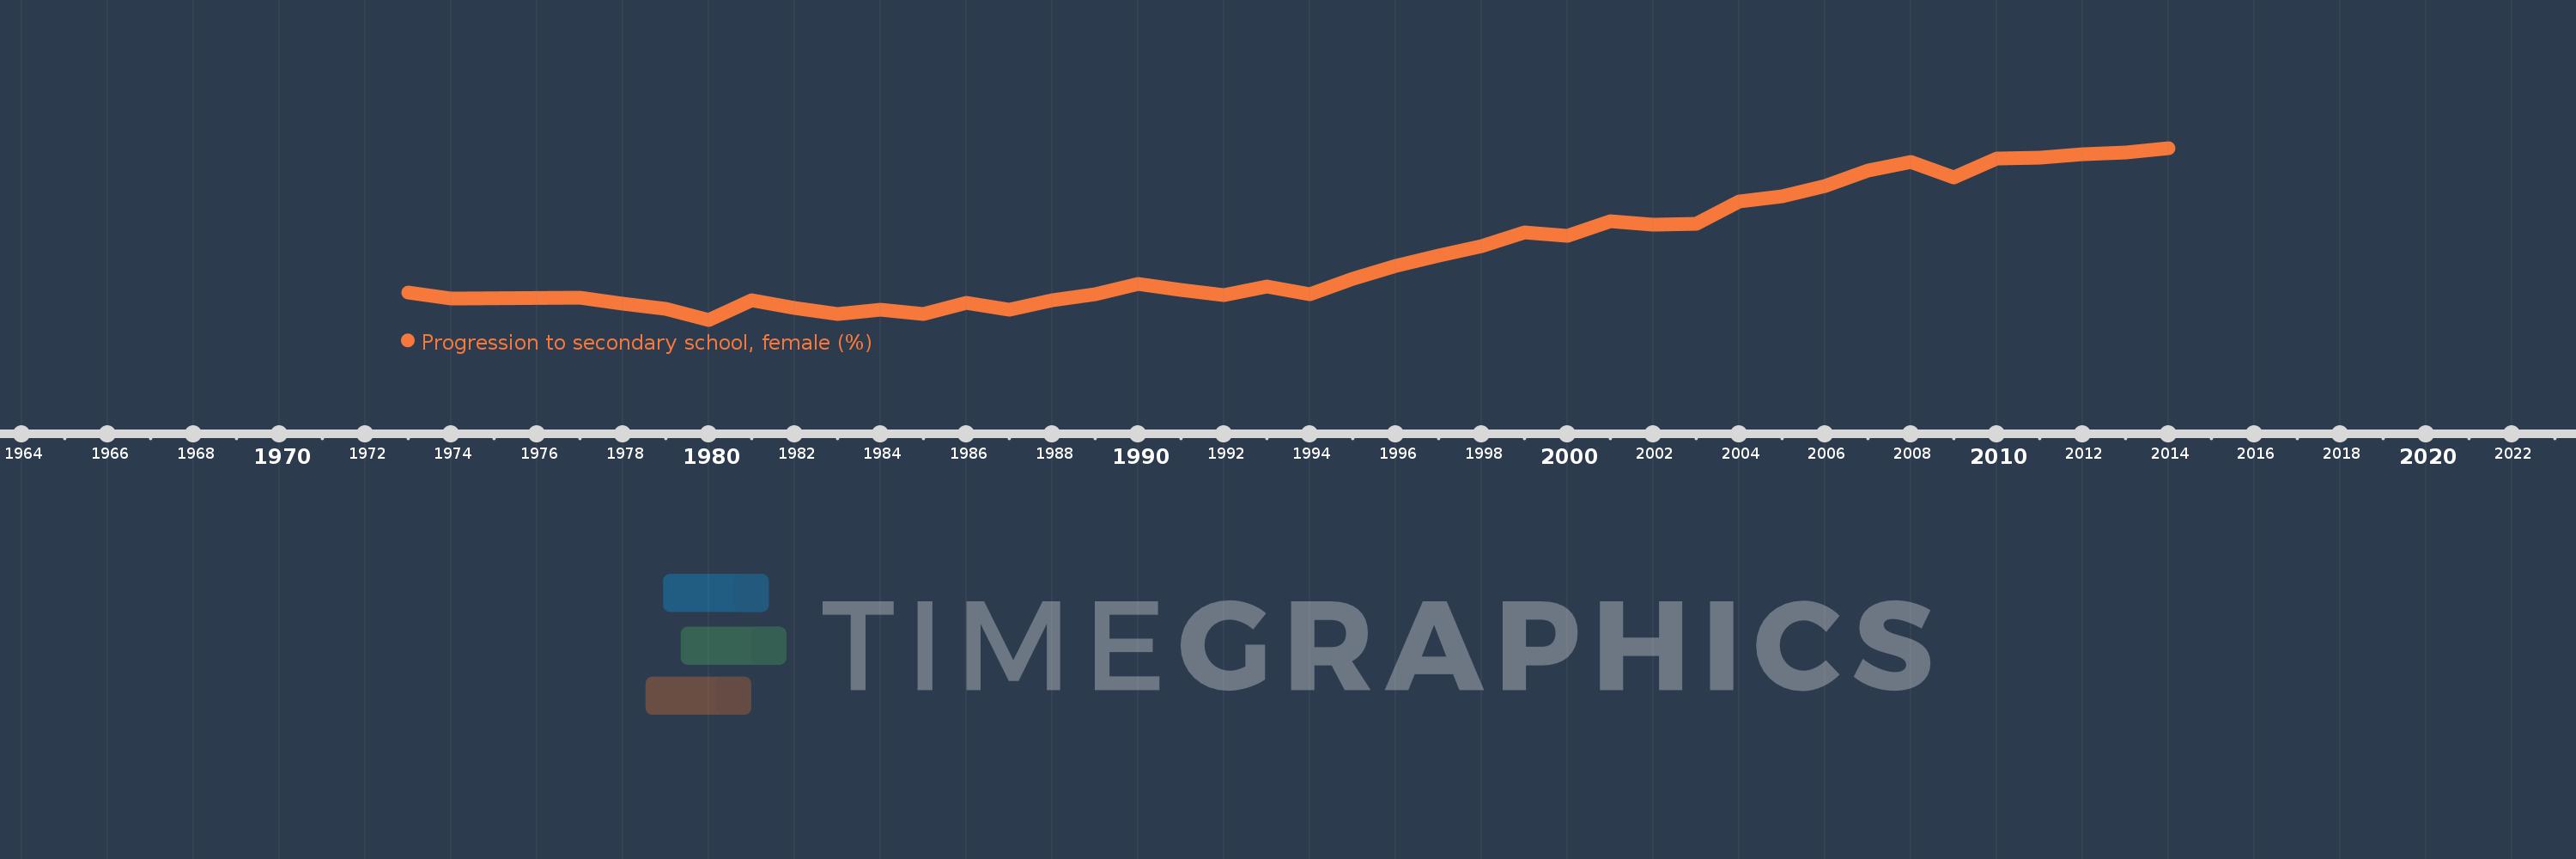
Progression to secondary school, female (%)
2014,2013,2012,2011,2010,2009,2008,2007,2006,2005,2004,2003,2002,2001,2000,1999,1998,1997,1996,1995,1994,1993,1992,1991,1990,1989,1988,1987,1986,1985,1984,1983,1982,1981,1980,1979,1978,1977,1974,1973
This statistics in other country:
AfghanistanAlbaniaAlgeriaAngolaAntigua and BarbudaArab WorldArgentinaArmeniaArubaAustriaAzerbaijanBahamas, TheBahrainBarbadosBelarusBelgiumBelizeBeninBermudaBhutanBoliviaBosnia and HerzegovinaBotswanaBrazilBritish Virgin IslandsBrunei DarussalamBulgariaBurkina FasoBurundiCabo VerdeCambodiaCameroonCaribbean small statesCayman IslandsCentral African RepublicCentral Europe and the BalticsChadChileChinaColombiaComorosCongo, Dem. Rep.Congo, Rep.Costa RicaCote d'IvoireCroatiaCubaCyprusCzech RepublicDenmarkDjiboutiDominicaDominican RepublicEarly-demographic dividendEast Asia & PacificEast Asia & Pacific (excluding high income)East Asia & Pacific (IDA & IBRD countries)EcuadorEgypt, Arab Rep.El SalvadorEquatorial GuineaEritreaEstoniaEthiopiaEuro areaEurope & Central AsiaEurope & Central Asia (excluding high income)Europe & Central Asia (IDA & IBRD countries)European UnionFijiFinlandFragile and conflict affected situationsGabonGambia, TheGeorgiaGermanyGhanaGreeceGrenadaGuatemalaGuineaGuinea-BissauGuyanaHaitiHeavily indebted poor countries (HIPC)High incomeHondurasHong Kong SAR, ChinaHungaryIBRD onlyIcelandIDA & IBRD totalIDA blendIDA onlyIDA totalIndiaIndonesiaIran, Islamic Rep.IraqIsraelItalyJamaicaJapanJordanKazakhstanKenyaKiribatiKorea, Rep.KuwaitKyrgyz RepublicLao PDRLate-demographic dividendLatin America & Caribbean Latin America & Caribbean (excluding high income)Latin America & the Caribbean (IDA & IBRD countries)LatviaLeast developed countries: UN classificationLebanonLesothoLiberiaLibyaLiechtensteinLithuaniaLow & middle incomeLow incomeLower middle incomeLuxembourgMacao SAR, ChinaMacedonia, FYRMadagascarMalawiMalaysiaMaldivesMaliMaltaMarshall IslandsMauritaniaMauritiusMexicoMiddle East & North AfricaMiddle East & North Africa (excluding high income)Middle East & North Africa (IDA & IBRD countries)Middle incomeMoldovaMonacoMongoliaMoroccoMozambiqueMyanmarNamibiaNepalNetherlandsNicaraguaNigerNorwayOECD membersOmanOther small statesPacific island small statesPakistanPalauPanamaParaguayPeruPhilippinesPolandPortugalPost-demographic dividendPre-demographic dividendQatarRomaniaRussian FederationRwandaSamoaSan MarinoSao Tome and PrincipeSaudi ArabiaSenegalSerbiaSeychellesSierra LeoneSingaporeSlovak RepublicSloveniaSmall statesSolomon IslandsSouth AfricaSouth AsiaSouth Asia (IDA & IBRD)SpainSri LankaSt. Kitts and NevisSt. LuciaSt. Vincent and the GrenadinesSub-Saharan Africa Sub-Saharan Africa (excluding high income)Sub-Saharan Africa (IDA & IBRD countries)SudanSurinameSwazilandSwedenSwitzerlandSyrian Arab RepublicTajikistanTanzaniaThailandTimor-LesteTogoTongaTrinidad and TobagoTunisiaTurkeyTurks and Caicos IslandsTuvaluUgandaUkraineUnited Arab EmiratesUpper middle incomeUruguayUzbekistanVanuatuVenezuela, RBVietnamWest Bank and GazaWorldYemen, Rep.ZambiaZimbabwe Timeline:
This timeline shows a graph from 1973 to 2014 of Pre-demographic dividend. No data until 1972. Number of actual observations by date: 40.
Source name:
World Development Indicators
Source organization:
United Nations Educational, Scientific, and Cultural Organization (UNESCO) Institute for Statistics.
Categories, topics:
Education, Gender
Last updated:
apr 23, 2017
Indicators value changes by year
Minimum:
52.857
jan 1, 1980
Maximum:
73.256
jan 1, 2014
At the date of observation
Value
Absolute change
Change from previous value
jan 1, 1973
56.086
+56.086
0.0%
jan 1, 1974
55.365
-0.721
-1.29%
jan 1, 1977
55.498
+0.133
0.24%
jan 1, 1978
54.756
-0.742
-1.34%
jan 1, 1979
54.163
-0.593
-1.08%
jan 1, 1980
52.857
-1.306
-2.41%
jan 1, 1981
55.158
+2.301
4.35%
jan 1, 1982
54.245
-0.913
-1.66%
jan 1, 1983
53.529
-0.716
-1.32%
jan 1, 1984
54.055
+0.527
0.98%
jan 1, 1985
53.51
-0.546
-1.01%
jan 1, 1986
54.833
+1.324
2.47%
jan 1, 1987
54.015
-0.818
-1.49%
jan 1, 1988
55.2
+1.185
2.19%
jan 1, 1989
55.921
+0.721
1.31%
jan 1, 1990
57.115
+1.194
2.13%
jan 1, 1991
56.433
-0.682
-1.19%
jan 1, 1992
55.752
-0.681
-1.21%
jan 1, 1993
56.756
+1.004
1.8%
jan 1, 1994
55.859
-0.898
-1.58%
jan 1, 1995
57.737
+1.878
3.36%
jan 1, 1996
59.263
+1.526
2.64%
jan 1, 1997
60.525
+1.262
2.13%
jan 1, 1998
61.579
+1.054
1.74%
jan 1, 1999
63.232
+1.653
2.68%
jan 1, 2000
62.8
-0.432
-0.68%
jan 1, 2001
64.516
+1.716
2.73%
jan 1, 2002
64.151
-0.365
-0.57%
jan 1, 2003
64.236
+0.085
0.13%
jan 1, 2004
66.899
+2.663
4.15%
jan 1, 2005
67.466
+0.567
0.85%
jan 1, 2006
68.728
+1.262
1.87%
jan 1, 2007
70.549
+1.821
2.65%
jan 1, 2008
71.636
+1.087
1.54%
jan 1, 2009
69.752
-1.884
-2.63%
jan 1, 2010
71.979
+2.227
3.19%
jan 1, 2011
72.135
+0.156
0.22%
jan 1, 2012
72.464
+0.33
0.46%
jan 1, 2013
72.718
+0.253
0.35%
jan 1, 2014
73.256
+0.538
0.74%
Ranking of countries by current statistics by years


Comments: