29
/
en
AIzaSyAYiBZKx7MnpbEhh9jyipgxe19OcubqV5w
April 1, 2024
55706
Pre-demographic dividend
PRE
false
2
1
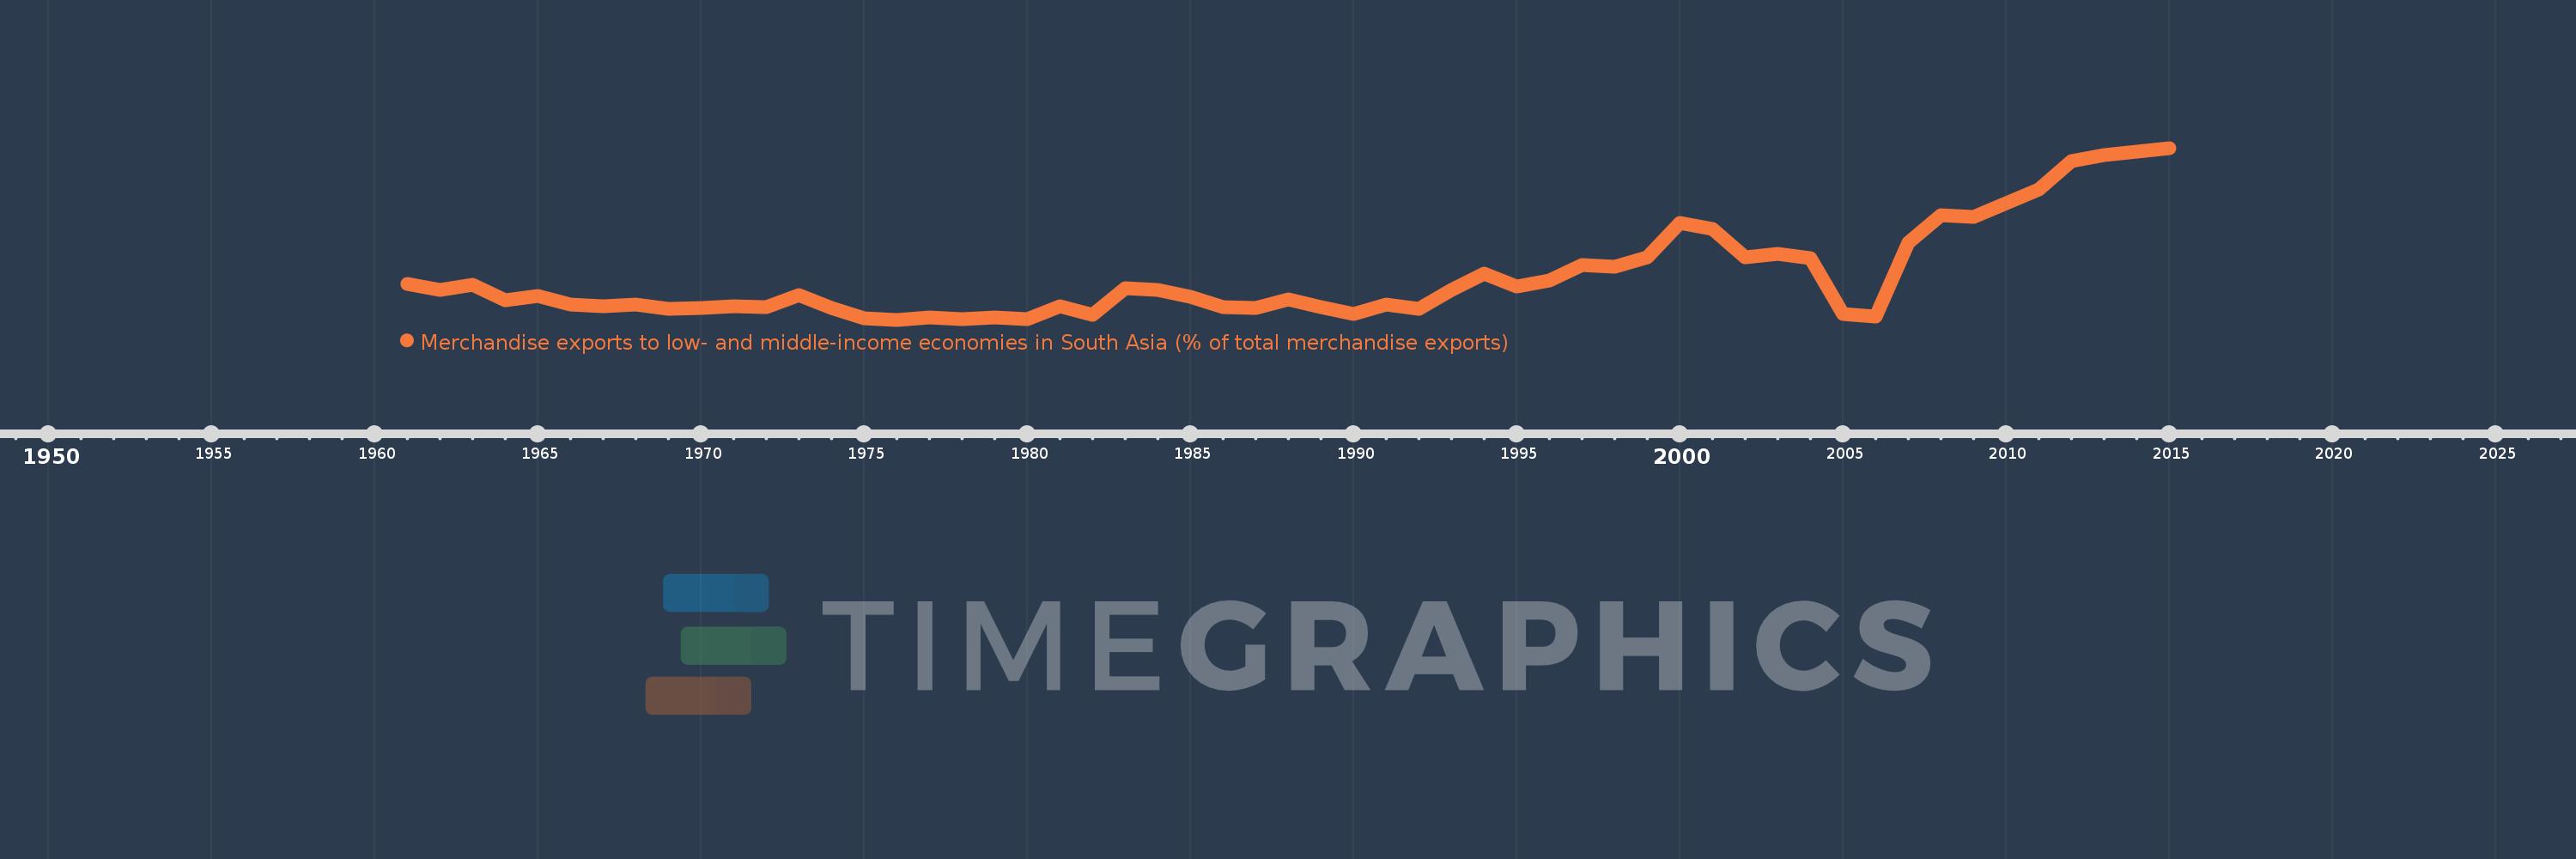
Merchandise exports to low- and middle-income economies in South Asia (% of total merchandise exports)
2015,2014,2013,2012,2011,2010,2009,2008,2007,2006,2005,2004,2003,2002,2001,2000,1999,1998,1997,1996,1995,1994,1993,1992,1991,1990,1989,1988,1987,1986,1985,1984,1983,1982,1981,1980,1979,1978,1977,1976,1975,1974,1973,1972,1971,1970,1969,1968,1967,1966,1965,1964,1963,1962,1961
This statistics in other country:
AfghanistanAlbaniaAlgeriaAngolaAntigua and BarbudaArab WorldArgentinaArmeniaArubaAustraliaAustriaAzerbaijanBahamas, TheBahrainBangladeshBarbadosBelarusBelgiumBelizeBeninBermudaBoliviaBrazilBrunei DarussalamBulgariaBurkina FasoBurundiCabo VerdeCambodiaCameroonCanadaCaribbean small statesCentral African RepublicCentral Europe and the BalticsChadChileChinaColombiaCongo, Rep.Costa RicaCote d'IvoireCroatiaCyprusCzech RepublicDenmarkDjiboutiDominicaDominican RepublicEarly-demographic dividendEast Asia & PacificEast Asia & Pacific (excluding high income)East Asia & Pacific (IDA & IBRD countries)EcuadorEgypt, Arab Rep.El SalvadorEstoniaEthiopiaEuro areaEurope & Central AsiaEurope & Central Asia (excluding high income)Europe & Central Asia (IDA & IBRD countries)European UnionFaroe IslandsFijiFinlandFragile and conflict affected situationsFranceGabonGambia, TheGeorgiaGermanyGhanaGibraltarGreeceGreenlandGrenadaGuatemalaGuineaGuyanaHaitiHeavily indebted poor countries (HIPC)High incomeHondurasHong Kong SAR, ChinaHungaryIBRD onlyIcelandIDA & IBRD totalIDA blendIDA onlyIDA totalIndiaIndonesiaIran, Islamic Rep.IraqIrelandIsraelItalyJamaicaJapanJordanKazakhstanKenyaKiribatiKorea, Dem. People’s Rep.Korea, Rep.KosovoKuwaitKyrgyz RepublicLao PDRLate-demographic dividendLatin America & Caribbean Latin America & Caribbean (excluding high income)Latin America & the Caribbean (IDA & IBRD countries)LatviaLeast developed countries: UN classificationLebanonLiberiaLibyaLithuaniaLow & middle incomeLow incomeLower middle incomeLuxembourgMacao SAR, ChinaMacedonia, FYRMadagascarMalawiMalaysiaMaldivesMaliMaltaMauritaniaMauritiusMexicoMiddle East & North AfricaMiddle East & North Africa (excluding high income)Middle East & North Africa (IDA & IBRD countries)Middle incomeMoldovaMongoliaMontenegroMoroccoMozambiqueMyanmarNauruNepalNetherlandsNew CaledoniaNew ZealandNicaraguaNigerNigeriaNorth AmericaNorwayOECD membersOmanOther small statesPacific island small statesPakistanPanamaPapua New GuineaParaguayPeruPhilippinesPolandPortugalPost-demographic dividendPre-demographic dividendQatarRomaniaRussian FederationRwandaSamoaSaudi ArabiaSenegalSerbiaSeychellesSierra LeoneSingaporeSlovak RepublicSloveniaSmall statesSomaliaSouth AfricaSouth AsiaSouth Asia (IDA & IBRD)SpainSri LankaSt. LuciaSt. Vincent and the GrenadinesSub-Saharan Africa Sub-Saharan Africa (excluding high income)Sub-Saharan Africa (IDA & IBRD countries)SudanSurinameSwedenSwitzerlandSyrian Arab RepublicTajikistanTanzaniaThailandTogoTongaTrinidad and TobagoTunisiaTurkeyTurkmenistanUgandaUkraineUnited Arab EmiratesUnited KingdomUnited StatesUpper middle incomeUruguayVanuatuVenezuela, RBVietnamWorldYemen, Rep.ZambiaZimbabwe Timeline:
This timeline shows a graph from 1961 to 2015 of Pre-demographic dividend. No data until 1960. Number of actual observations by date: 55.
Source name:
World Development Indicators
Source organization:
World Bank staff estimates based data from International Monetary Fund's Direction of Trade database.
Categories, topics:
Private Sector, Trade
Last updated:
apr 23, 2017
Indicators value changes by year
Maximum:
11.918
jan 1, 2015
At the date of observation
Value
Absolute change
Change from previous value
jan 1, 1961
3.106
+3.106
0.0%
jan 1, 1962
2.727
-0.379
-12.19%
jan 1, 1963
3.076
+0.349
12.79%
jan 1, 1964
2.054
-1.022
-33.22%
jan 1, 1965
2.371
+0.316
15.4%
jan 1, 1966
1.787
-0.584
-24.63%
jan 1, 1967
1.682
-0.104
-5.85%
jan 1, 1968
1.803
+0.121
7.2%
jan 1, 1969
1.529
-0.275
-15.23%
jan 1, 1970
1.599
+0.07
4.58%
jan 1, 1971
1.708
+0.11
6.87%
jan 1, 1972
1.63
-0.078
-4.58%
jan 1, 1973
2.423
+0.793
48.63%
jan 1, 1974
1.565
-0.858
-35.4%
jan 1, 1975
0.934
-0.631
-40.33%
jan 1, 1976
0.819
-0.115
-12.35%
jan 1, 1977
0.968
+0.149
18.19%
jan 1, 1978
0.871
-0.097
-9.99%
jan 1, 1979
0.992
+0.121
13.9%
jan 1, 1980
0.854
-0.138
-13.91%
jan 1, 1981
1.691
+0.837
98.0%
jan 1, 1982
1.158
-0.533
-31.52%
jan 1, 1983
2.859
+1.701
146.84%
jan 1, 1984
2.723
-0.136
-4.75%
jan 1, 1985
2.307
-0.416
-15.27%
jan 1, 1986
1.646
-0.661
-28.65%
jan 1, 1987
1.558
-0.088
-5.33%
jan 1, 1988
2.149
+0.59
37.88%
jan 1, 1989
1.638
-0.511
-23.76%
jan 1, 1990
1.164
-0.474
-28.95%
jan 1, 1991
1.809
+0.645
55.41%
jan 1, 1992
1.51
-0.299
-16.52%
jan 1, 1993
2.752
+1.242
82.26%
jan 1, 1994
3.801
+1.049
38.11%
jan 1, 1995
2.974
-0.827
-21.76%
jan 1, 1996
3.354
+0.379
12.75%
jan 1, 1997
4.362
+1.009
30.07%
jan 1, 1998
4.218
-0.145
-3.31%
jan 1, 1999
4.84
+0.622
14.75%
jan 1, 2000
7.086
+2.247
46.43%
jan 1, 2001
6.659
-0.428
-6.03%
jan 1, 2002
4.87
-1.788
-26.86%
jan 1, 2003
5.055
+0.185
3.79%
jan 1, 2004
4.824
-0.231
-4.57%
jan 1, 2005
1.211
-3.613
-74.9%
jan 1, 2006
1.035
-0.175
-14.49%
jan 1, 2007
5.778
+4.743
458.09%
jan 1, 2008
7.552
+1.774
30.71%
jan 1, 2009
7.462
-0.091
-1.2%
jan 1, 2010
8.355
+0.893
11.97%
jan 1, 2011
9.258
+0.903
10.8%
jan 1, 2012
11.061
+1.804
19.48%
jan 1, 2013
11.447
+0.386
3.49%
jan 1, 2014
11.67
+0.223
1.95%
jan 1, 2015
11.918
+0.248
2.12%
Ranking of countries by current statistics by years


Comments: