29
/
en
AIzaSyAYiBZKx7MnpbEhh9jyipgxe19OcubqV5w
April 1, 2024
25084
Caribbean small states
CSS
false
2
1
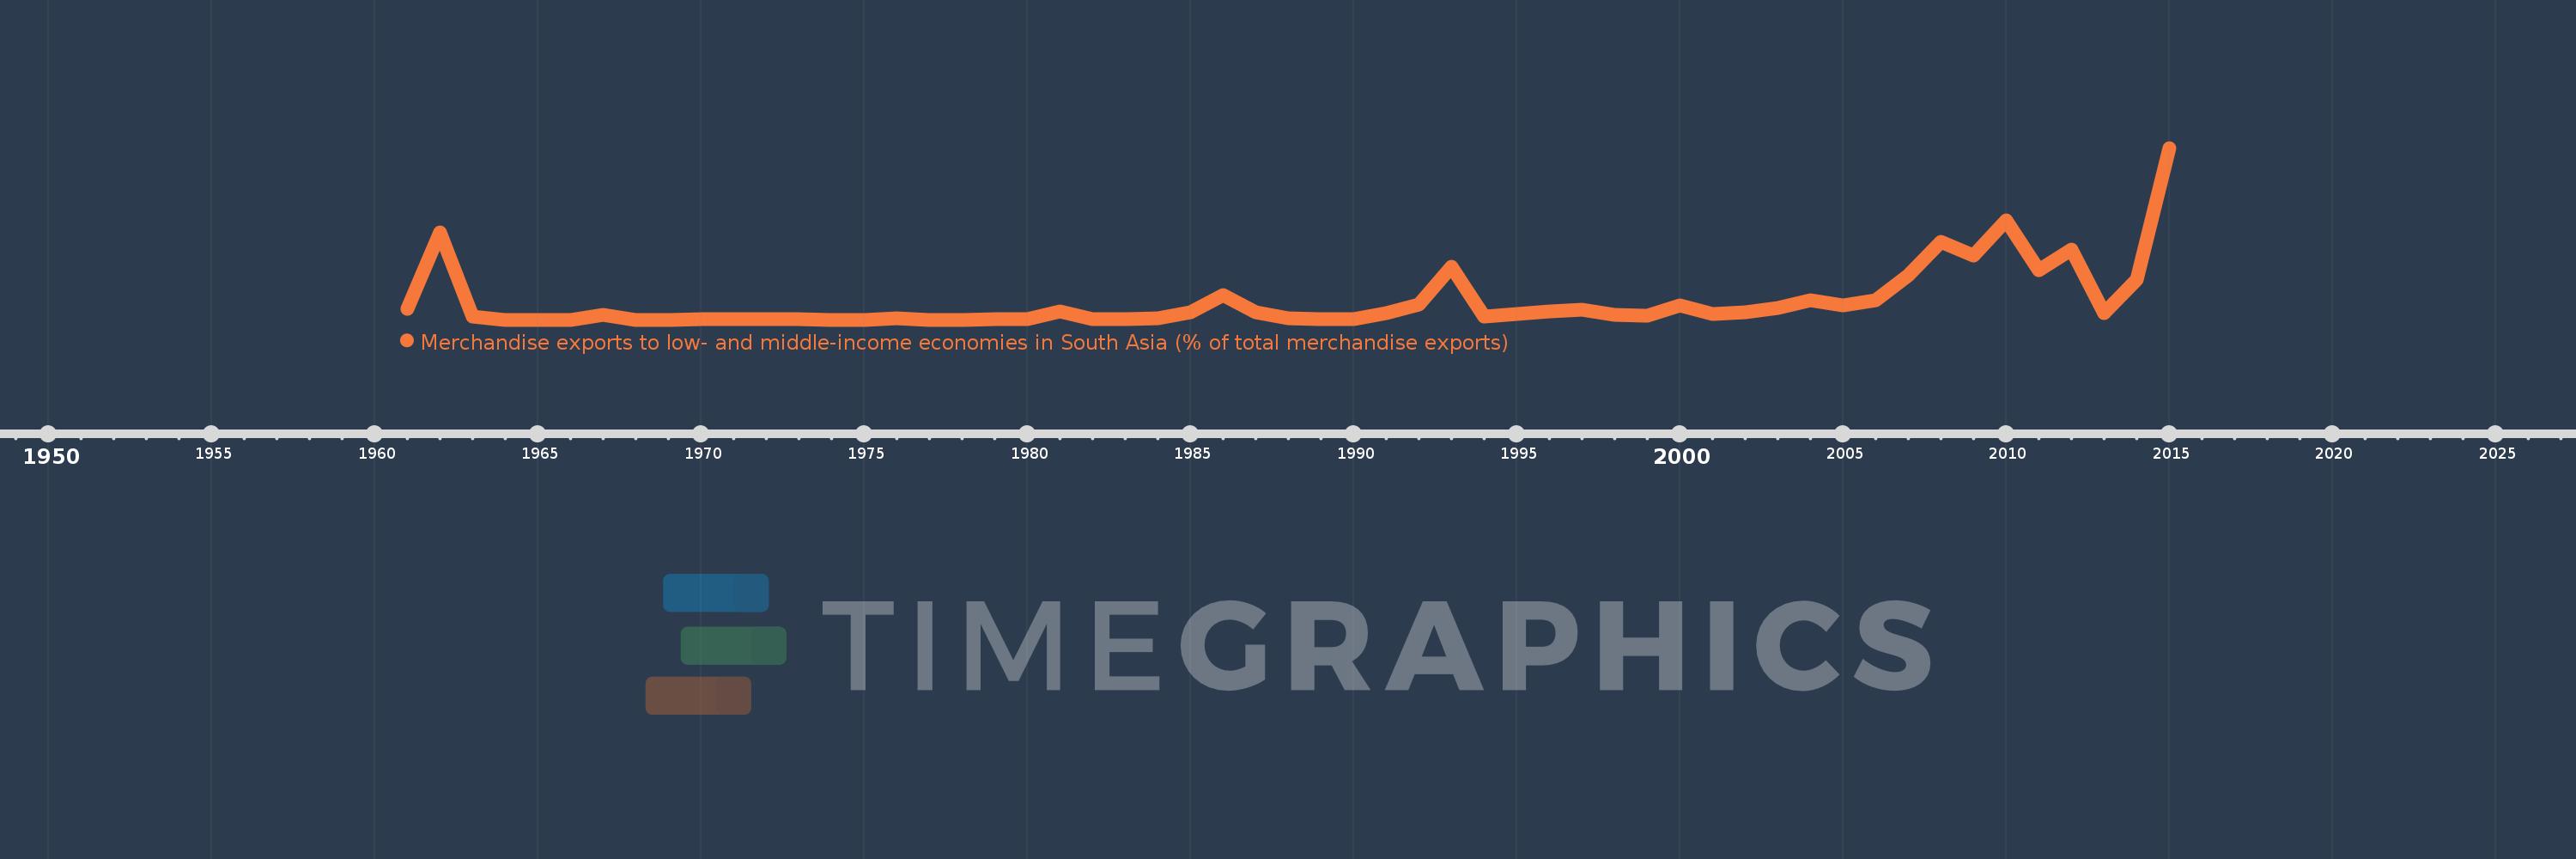
Merchandise exports to low- and middle-income economies in South Asia (% of total merchandise exports)
2015,2014,2013,2012,2011,2010,2009,2008,2007,2006,2005,2004,2003,2002,2001,2000,1999,1998,1997,1996,1995,1994,1993,1992,1991,1990,1989,1988,1987,1986,1985,1984,1983,1982,1981,1980,1979,1978,1977,1976,1975,1974,1973,1972,1971,1970,1969,1968,1967,1966,1965,1964,1963,1962,1961
This statistics in other country:
AfghanistanAlbaniaAlgeriaAngolaAntigua and BarbudaArab WorldArgentinaArmeniaArubaAustraliaAustriaAzerbaijanBahamas, TheBahrainBangladeshBarbadosBelarusBelgiumBelizeBeninBermudaBoliviaBrazilBrunei DarussalamBulgariaBurkina FasoBurundiCabo VerdeCambodiaCameroonCanadaCaribbean small statesCentral African RepublicCentral Europe and the BalticsChadChileChinaColombiaCongo, Rep.Costa RicaCote d'IvoireCroatiaCyprusCzech RepublicDenmarkDjiboutiDominicaDominican RepublicEarly-demographic dividendEast Asia & PacificEast Asia & Pacific (excluding high income)East Asia & Pacific (IDA & IBRD countries)EcuadorEgypt, Arab Rep.El SalvadorEstoniaEthiopiaEuro areaEurope & Central AsiaEurope & Central Asia (excluding high income)Europe & Central Asia (IDA & IBRD countries)European UnionFaroe IslandsFijiFinlandFragile and conflict affected situationsFranceGabonGambia, TheGeorgiaGermanyGhanaGibraltarGreeceGreenlandGrenadaGuatemalaGuineaGuyanaHaitiHeavily indebted poor countries (HIPC)High incomeHondurasHong Kong SAR, ChinaHungaryIBRD onlyIcelandIDA & IBRD totalIDA blendIDA onlyIDA totalIndiaIndonesiaIran, Islamic Rep.IraqIrelandIsraelItalyJamaicaJapanJordanKazakhstanKenyaKiribatiKorea, Dem. People’s Rep.Korea, Rep.KosovoKuwaitKyrgyz RepublicLao PDRLate-demographic dividendLatin America & Caribbean Latin America & Caribbean (excluding high income)Latin America & the Caribbean (IDA & IBRD countries)LatviaLeast developed countries: UN classificationLebanonLiberiaLibyaLithuaniaLow & middle incomeLow incomeLower middle incomeLuxembourgMacao SAR, ChinaMacedonia, FYRMadagascarMalawiMalaysiaMaldivesMaliMaltaMauritaniaMauritiusMexicoMiddle East & North AfricaMiddle East & North Africa (excluding high income)Middle East & North Africa (IDA & IBRD countries)Middle incomeMoldovaMongoliaMontenegroMoroccoMozambiqueMyanmarNauruNepalNetherlandsNew CaledoniaNew ZealandNicaraguaNigerNigeriaNorth AmericaNorwayOECD membersOmanOther small statesPacific island small statesPakistanPanamaPapua New GuineaParaguayPeruPhilippinesPolandPortugalPost-demographic dividendPre-demographic dividendQatarRomaniaRussian FederationRwandaSamoaSaudi ArabiaSenegalSerbiaSeychellesSierra LeoneSingaporeSlovak RepublicSloveniaSmall statesSomaliaSouth AfricaSouth AsiaSouth Asia (IDA & IBRD)SpainSri LankaSt. LuciaSt. Vincent and the GrenadinesSub-Saharan Africa Sub-Saharan Africa (excluding high income)Sub-Saharan Africa (IDA & IBRD countries)SudanSurinameSwedenSwitzerlandSyrian Arab RepublicTajikistanTanzaniaThailandTogoTongaTrinidad and TobagoTunisiaTurkeyTurkmenistanUgandaUkraineUnited Arab EmiratesUnited KingdomUnited StatesUpper middle incomeUruguayVanuatuVenezuela, RBVietnamWorldYemen, Rep.ZambiaZimbabwe Timeline:
This timeline shows a graph from 1961 to 2015 of Caribbean small states. No data until 1960. Number of actual observations by date: 55.
Source name:
World Development Indicators
Source organization:
World Bank staff estimates based data from International Monetary Fund's Direction of Trade database.
Categories, topics:
Private Sector, Trade
Last updated:
apr 23, 2017
Indicators value changes by year
At the date of observation
Value
Absolute change
Change from previous value
jan 1, 1961
0.124
+0.124
0.0%
jan 1, 1962
0.983
+0.859
692.01%
jan 1, 1963
0.036
-0.948
-96.38%
jan 1, 1964
0.0
-0.036
-100.0%
jan 1, 1967
0.054
+0.054
44.99K%
jan 1, 1968
0.0
-0.054
-99.61%
jan 1, 1970
0.002
+0.002
793.4%
jan 1, 1971
0.002
0.0
-5.1%
jan 1, 1972
0.004
+0.002
136.97%
jan 1, 1973
0.002
-0.002
-56.21%
jan 1, 1974
0.001
-0.001
-54.84%
jan 1, 1975
0.001
+0.0
3.28%
jan 1, 1976
0.012
+0.011
1.36K%
jan 1, 1977
0.001
-0.011
-93.7%
jan 1, 1978
0.001
+0.001
68.43%
jan 1, 1979
0.002
+0.001
64.06%
jan 1, 1980
0.005
+0.003
124.78%
jan 1, 1981
0.095
+0.091
1.94K%
jan 1, 1982
0.003
-0.092
-96.53%
jan 1, 1983
0.002
-0.001
-37.08%
jan 1, 1984
0.012
+0.01
494.99%
jan 1, 1985
0.084
+0.071
574.28%
jan 1, 1986
0.281
+0.198
236.85%
jan 1, 1987
0.084
-0.198
-70.27%
jan 1, 1988
0.021
-0.063
-75.48%
jan 1, 1989
0.006
-0.014
-70.43%
jan 1, 1990
0.006
+0.0
1.71%
jan 1, 1991
0.074
+0.068
1.1K%
jan 1, 1992
0.171
+0.097
131.28%
jan 1, 1993
0.596
+0.425
248.81%
jan 1, 1994
0.032
-0.564
-94.6%
jan 1, 1995
0.061
+0.029
89.39%
jan 1, 1996
0.094
+0.033
54.86%
jan 1, 1997
0.111
+0.017
17.8%
jan 1, 1998
0.053
-0.058
-51.92%
jan 1, 1999
0.042
-0.012
-21.88%
jan 1, 2000
0.158
+0.116
277.04%
jan 1, 2001
0.063
-0.095
-60.13%
jan 1, 2002
0.081
+0.018
29.36%
jan 1, 2003
0.129
+0.048
58.49%
jan 1, 2004
0.22
+0.091
71.04%
jan 1, 2005
0.157
-0.063
-28.63%
jan 1, 2006
0.221
+0.064
40.61%
jan 1, 2007
0.496
+0.275
124.57%
jan 1, 2008
0.875
+0.378
76.21%
jan 1, 2009
0.721
-0.154
-17.56%
jan 1, 2010
1.11
+0.389
53.99%
jan 1, 2011
0.552
-0.558
-50.24%
jan 1, 2012
0.788
+0.236
42.64%
jan 1, 2013
0.074
-0.714
-90.67%
jan 1, 2014
0.454
+0.38
517.22%
jan 1, 2015
1.925
+1.472
324.14%
Ranking of countries by current statistics by years


Comments: