29
/
en
AIzaSyAYiBZKx7MnpbEhh9jyipgxe19OcubqV5w
April 1, 2024
30062
Euro area
EMU
false
2
1
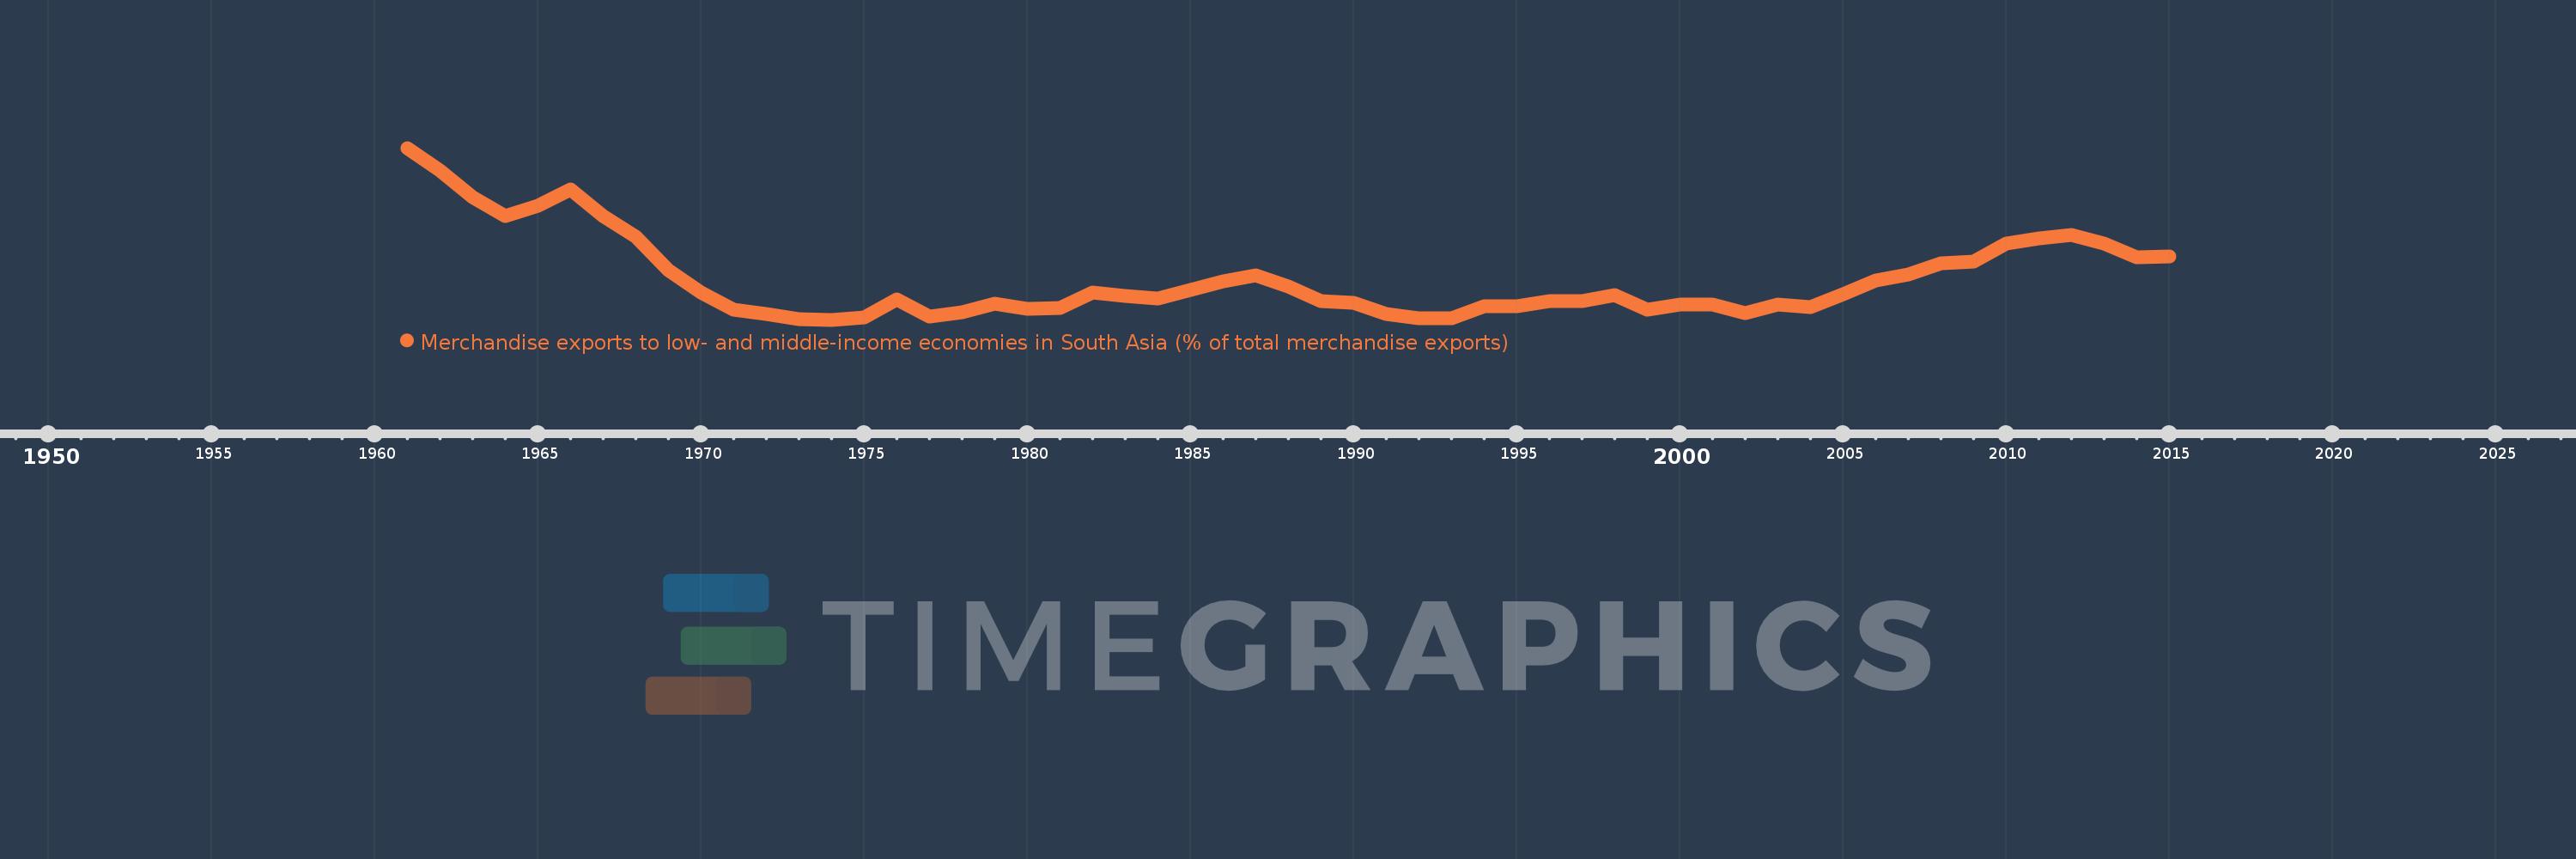
Merchandise exports to low- and middle-income economies in South Asia (% of total merchandise exports)
2015,2014,2013,2012,2011,2010,2009,2008,2007,2006,2005,2004,2003,2002,2001,2000,1999,1998,1997,1996,1995,1994,1993,1992,1991,1990,1989,1988,1987,1986,1985,1984,1983,1982,1981,1980,1979,1978,1977,1976,1975,1974,1973,1972,1971,1970,1969,1968,1967,1966,1965,1964,1963,1962,1961
This statistics in other country:
AfghanistanAlbaniaAlgeriaAngolaAntigua and BarbudaArab WorldArgentinaArmeniaArubaAustraliaAustriaAzerbaijanBahamas, TheBahrainBangladeshBarbadosBelarusBelgiumBelizeBeninBermudaBoliviaBrazilBrunei DarussalamBulgariaBurkina FasoBurundiCabo VerdeCambodiaCameroonCanadaCaribbean small statesCentral African RepublicCentral Europe and the BalticsChadChileChinaColombiaCongo, Rep.Costa RicaCote d'IvoireCroatiaCyprusCzech RepublicDenmarkDjiboutiDominicaDominican RepublicEarly-demographic dividendEast Asia & PacificEast Asia & Pacific (excluding high income)East Asia & Pacific (IDA & IBRD countries)EcuadorEgypt, Arab Rep.El SalvadorEstoniaEthiopiaEuro areaEurope & Central AsiaEurope & Central Asia (excluding high income)Europe & Central Asia (IDA & IBRD countries)European UnionFaroe IslandsFijiFinlandFragile and conflict affected situationsFranceGabonGambia, TheGeorgiaGermanyGhanaGibraltarGreeceGreenlandGrenadaGuatemalaGuineaGuyanaHaitiHeavily indebted poor countries (HIPC)High incomeHondurasHong Kong SAR, ChinaHungaryIBRD onlyIcelandIDA & IBRD totalIDA blendIDA onlyIDA totalIndiaIndonesiaIran, Islamic Rep.IraqIrelandIsraelItalyJamaicaJapanJordanKazakhstanKenyaKiribatiKorea, Dem. People’s Rep.Korea, Rep.KosovoKuwaitKyrgyz RepublicLao PDRLate-demographic dividendLatin America & Caribbean Latin America & Caribbean (excluding high income)Latin America & the Caribbean (IDA & IBRD countries)LatviaLeast developed countries: UN classificationLebanonLiberiaLibyaLithuaniaLow & middle incomeLow incomeLower middle incomeLuxembourgMacao SAR, ChinaMacedonia, FYRMadagascarMalawiMalaysiaMaldivesMaliMaltaMauritaniaMauritiusMexicoMiddle East & North AfricaMiddle East & North Africa (excluding high income)Middle East & North Africa (IDA & IBRD countries)Middle incomeMoldovaMongoliaMontenegroMoroccoMozambiqueMyanmarNauruNepalNetherlandsNew CaledoniaNew ZealandNicaraguaNigerNigeriaNorth AmericaNorwayOECD membersOmanOther small statesPacific island small statesPakistanPanamaPapua New GuineaParaguayPeruPhilippinesPolandPortugalPost-demographic dividendPre-demographic dividendQatarRomaniaRussian FederationRwandaSamoaSaudi ArabiaSenegalSerbiaSeychellesSierra LeoneSingaporeSlovak RepublicSloveniaSmall statesSomaliaSouth AfricaSouth AsiaSouth Asia (IDA & IBRD)SpainSri LankaSt. LuciaSt. Vincent and the GrenadinesSub-Saharan Africa Sub-Saharan Africa (excluding high income)Sub-Saharan Africa (IDA & IBRD countries)SudanSurinameSwedenSwitzerlandSyrian Arab RepublicTajikistanTanzaniaThailandTogoTongaTrinidad and TobagoTunisiaTurkeyTurkmenistanUgandaUkraineUnited Arab EmiratesUnited KingdomUnited StatesUpper middle incomeUruguayVanuatuVenezuela, RBVietnamWorldYemen, Rep.ZambiaZimbabwe Timeline:
This timeline shows a graph from 1961 to 2015 of Euro area. No data until 1960. Number of actual observations by date: 55.
Source name:
World Development Indicators
Source organization:
World Bank staff estimates based data from International Monetary Fund's Direction of Trade database.
Categories, topics:
Private Sector, Trade
Last updated:
apr 23, 2017
Indicators value changes by year
At the date of observation
Value
Absolute change
Change from previous value
jan 1, 1961
1.673
+1.673
0.0%
jan 1, 1962
1.52
-0.153
-9.13%
jan 1, 1963
1.338
-0.183
-12.01%
jan 1, 1964
1.212
-0.126
-9.4%
jan 1, 1965
1.283
+0.071
5.87%
jan 1, 1966
1.39
+0.107
8.34%
jan 1, 1967
1.211
-0.179
-12.91%
jan 1, 1968
1.074
-0.137
-11.32%
jan 1, 1969
0.843
-0.231
-21.5%
jan 1, 1970
0.694
-0.149
-17.65%
jan 1, 1971
0.579
-0.115
-16.5%
jan 1, 1972
0.548
-0.032
-5.5%
jan 1, 1973
0.513
-0.035
-6.3%
jan 1, 1974
0.508
-0.006
-1.09%
jan 1, 1975
0.524
+0.017
3.31%
jan 1, 1976
0.648
+0.124
23.66%
jan 1, 1977
0.531
-0.117
-18.02%
jan 1, 1978
0.558
+0.026
4.91%
jan 1, 1979
0.619
+0.061
10.96%
jan 1, 1980
0.581
-0.037
-6.04%
jan 1, 1981
0.589
+0.008
1.32%
jan 1, 1982
0.695
+0.106
17.98%
jan 1, 1983
0.669
-0.026
-3.71%
jan 1, 1984
0.651
-0.018
-2.64%
jan 1, 1985
0.709
+0.058
8.85%
jan 1, 1986
0.769
+0.06
8.4%
jan 1, 1987
0.811
+0.042
5.48%
jan 1, 1988
0.735
-0.075
-9.31%
jan 1, 1989
0.637
-0.099
-13.39%
jan 1, 1990
0.621
-0.016
-2.53%
jan 1, 1991
0.549
-0.071
-11.49%
jan 1, 1992
0.515
-0.035
-6.3%
jan 1, 1993
0.516
+0.001
0.28%
jan 1, 1994
0.599
+0.083
16.06%
jan 1, 1995
0.599
+0.0
0.04%
jan 1, 1996
0.636
+0.037
6.18%
jan 1, 1997
0.632
-0.005
-0.74%
jan 1, 1998
0.673
+0.041
6.51%
jan 1, 1999
0.576
-0.097
-14.44%
jan 1, 2000
0.609
+0.034
5.85%
jan 1, 2001
0.61
+0.001
0.1%
jan 1, 2002
0.552
-0.058
-9.57%
jan 1, 2003
0.611
+0.06
10.85%
jan 1, 2004
0.596
-0.015
-2.47%
jan 1, 2005
0.68
+0.084
14.04%
jan 1, 2006
0.776
+0.096
14.08%
jan 1, 2007
0.815
+0.039
5.04%
jan 1, 2008
0.891
+0.076
9.35%
jan 1, 2009
0.905
+0.013
1.51%
jan 1, 2010
1.025
+0.12
13.32%
jan 1, 2011
1.062
+0.036
3.55%
jan 1, 2012
1.083
+0.021
1.97%
jan 1, 2013
1.023
-0.059
-5.48%
jan 1, 2014
0.934
-0.09
-8.75%
jan 1, 2015
0.938
+0.004
0.45%
Ranking of countries by current statistics by years


Comments: