29
/
en
AIzaSyAYiBZKx7MnpbEhh9jyipgxe19OcubqV5w
April 1, 2024
180141
Libya
LBY
true
2
1
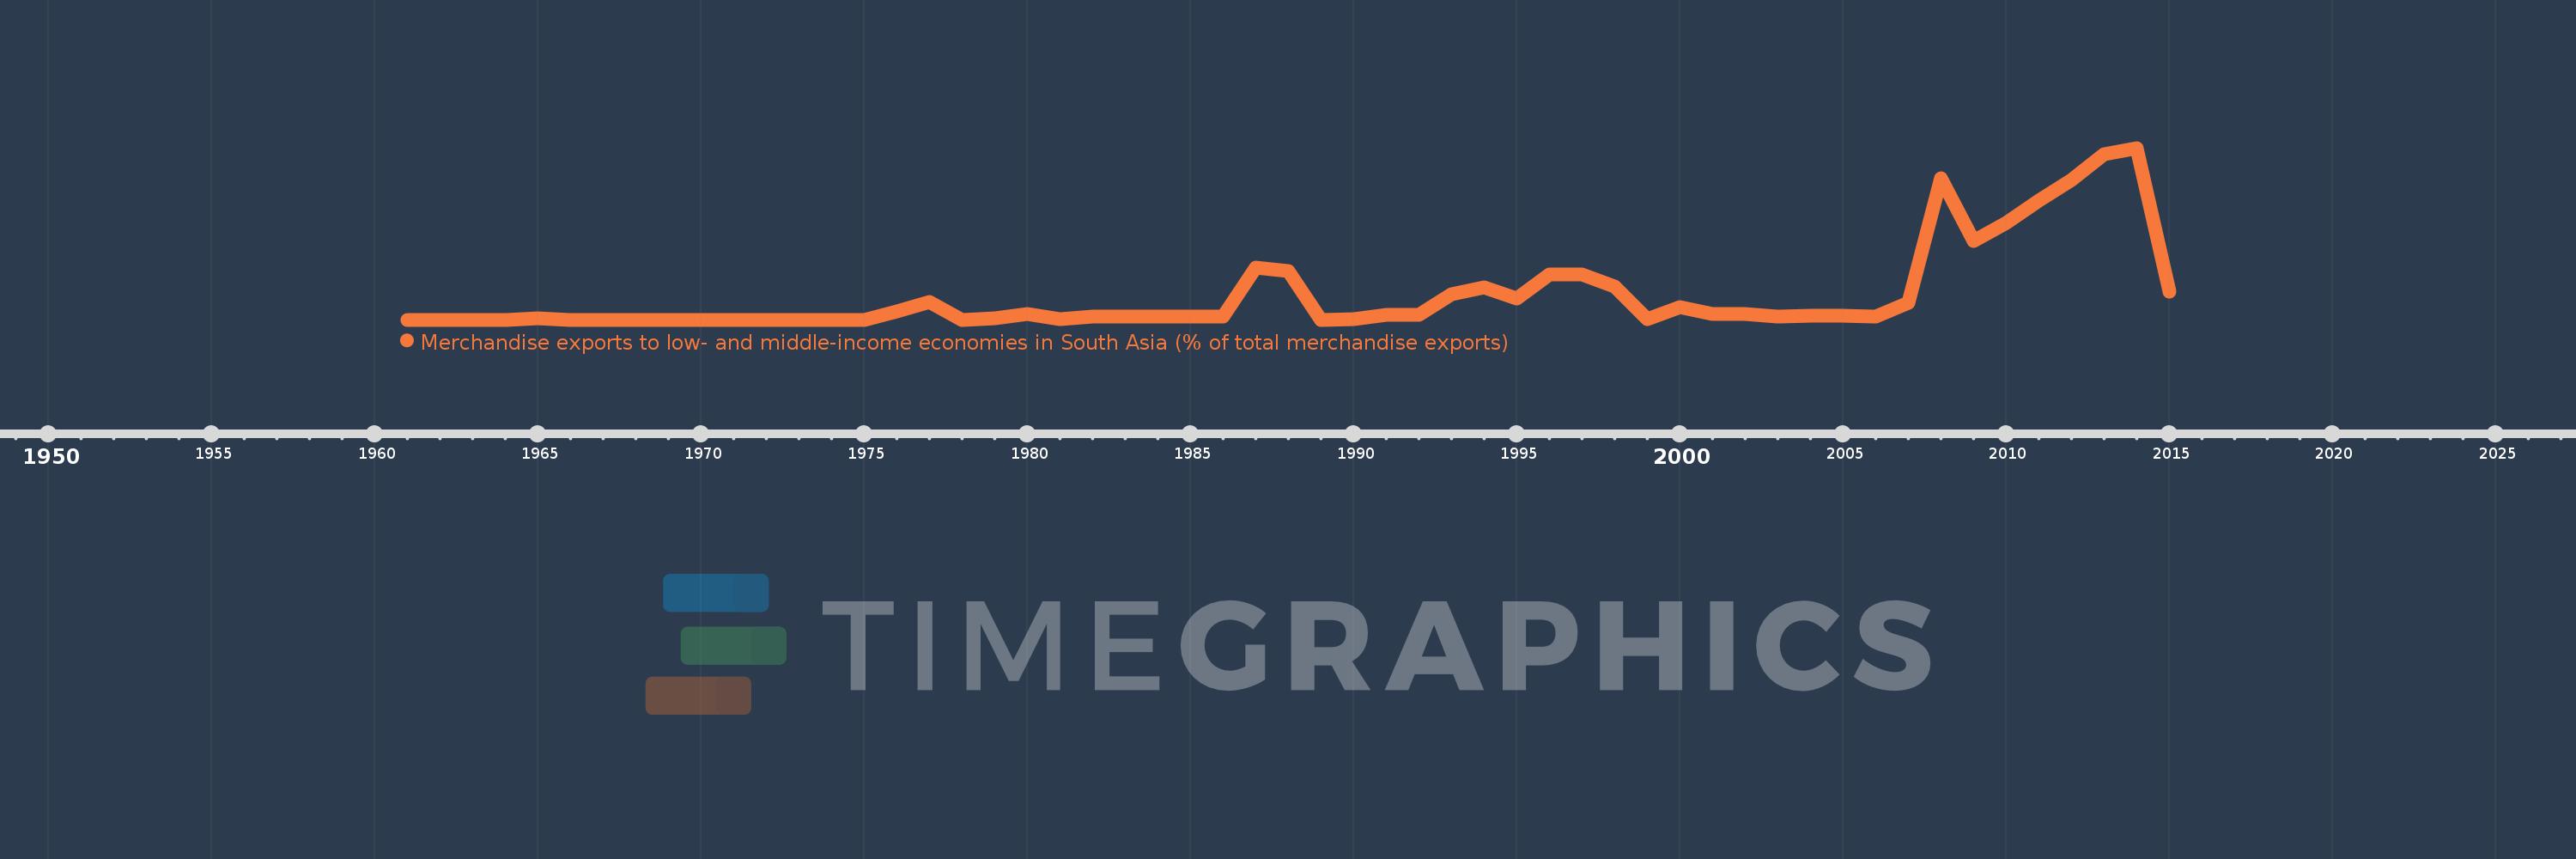
Merchandise exports to low- and middle-income economies in South Asia (% of total merchandise exports)
2015,2014,2013,2012,2011,2010,2009,2008,2007,2006,2005,2004,2003,2002,2001,2000,1999,1998,1997,1996,1995,1994,1993,1992,1991,1990,1989,1988,1987,1986,1985,1984,1983,1982,1981,1980,1979,1978,1977,1976,1975,1974,1973,1972,1971,1970,1969,1968,1967,1966,1965,1964,1963,1962,1961
This statistics in other country:
AfghanistanAlbaniaAlgeriaAngolaAntigua and BarbudaArab WorldArgentinaArmeniaArubaAustraliaAustriaAzerbaijanBahamas, TheBahrainBangladeshBarbadosBelarusBelgiumBelizeBeninBermudaBoliviaBrazilBrunei DarussalamBulgariaBurkina FasoBurundiCabo VerdeCambodiaCameroonCanadaCaribbean small statesCentral African RepublicCentral Europe and the BalticsChadChileChinaColombiaCongo, Rep.Costa RicaCote d'IvoireCroatiaCyprusCzech RepublicDenmarkDjiboutiDominicaDominican RepublicEarly-demographic dividendEast Asia & PacificEast Asia & Pacific (excluding high income)East Asia & Pacific (IDA & IBRD countries)EcuadorEgypt, Arab Rep.El SalvadorEstoniaEthiopiaEuro areaEurope & Central AsiaEurope & Central Asia (excluding high income)Europe & Central Asia (IDA & IBRD countries)European UnionFaroe IslandsFijiFinlandFragile and conflict affected situationsFranceGabonGambia, TheGeorgiaGermanyGhanaGibraltarGreeceGreenlandGrenadaGuatemalaGuineaGuyanaHaitiHeavily indebted poor countries (HIPC)High incomeHondurasHong Kong SAR, ChinaHungaryIBRD onlyIcelandIDA & IBRD totalIDA blendIDA onlyIDA totalIndiaIndonesiaIran, Islamic Rep.IraqIrelandIsraelItalyJamaicaJapanJordanKazakhstanKenyaKiribatiKorea, Dem. People’s Rep.Korea, Rep.KosovoKuwaitKyrgyz RepublicLao PDRLate-demographic dividendLatin America & Caribbean Latin America & Caribbean (excluding high income)Latin America & the Caribbean (IDA & IBRD countries)LatviaLeast developed countries: UN classificationLebanonLiberiaLibyaLithuaniaLow & middle incomeLow incomeLower middle incomeLuxembourgMacao SAR, ChinaMacedonia, FYRMadagascarMalawiMalaysiaMaldivesMaliMaltaMauritaniaMauritiusMexicoMiddle East & North AfricaMiddle East & North Africa (excluding high income)Middle East & North Africa (IDA & IBRD countries)Middle incomeMoldovaMongoliaMontenegroMoroccoMozambiqueMyanmarNauruNepalNetherlandsNew CaledoniaNew ZealandNicaraguaNigerNigeriaNorth AmericaNorwayOECD membersOmanOther small statesPacific island small statesPakistanPanamaPapua New GuineaParaguayPeruPhilippinesPolandPortugalPost-demographic dividendPre-demographic dividendQatarRomaniaRussian FederationRwandaSamoaSaudi ArabiaSenegalSerbiaSeychellesSierra LeoneSingaporeSlovak RepublicSloveniaSmall statesSomaliaSouth AfricaSouth AsiaSouth Asia (IDA & IBRD)SpainSri LankaSt. LuciaSt. Vincent and the GrenadinesSub-Saharan Africa Sub-Saharan Africa (excluding high income)Sub-Saharan Africa (IDA & IBRD countries)SudanSurinameSwedenSwitzerlandSyrian Arab RepublicTajikistanTanzaniaThailandTogoTongaTrinidad and TobagoTunisiaTurkeyTurkmenistanUgandaUkraineUnited Arab EmiratesUnited KingdomUnited StatesUpper middle incomeUruguayVanuatuVenezuela, RBVietnamWorldYemen, Rep.ZambiaZimbabwe Timeline:
This timeline shows a graph from 1961 to 2015 of Libya. No data until 1960. Number of actual observations by date: 55.
Source name:
World Development Indicators
Source organization:
World Bank staff estimates based data from International Monetary Fund's Direction of Trade database.
Categories, topics:
Private Sector, Trade
Last updated:
apr 23, 2017
Indicators value changes by year
At the date of observation
Value
Absolute change
Change from previous value
jan 1, 1965
0.016
+0.016
%
jan 1, 1966
0.0
-0.016
-100.0%
jan 1, 1976
0.115
+0.115
%
jan 1, 1977
0.25
+0.136
118.21%
jan 1, 1978
0.0
-0.25
-100.0%
jan 1, 1979
0.018
+0.018
%
jan 1, 1980
0.078
+0.06
331.13%
jan 1, 1981
0.004
-0.075
-95.34%
jan 1, 1982
0.042
+0.039
1.06K%
jan 1, 1983
0.042
0.0
0.0%
jan 1, 1984
0.042
+0.0
0.0%
jan 1, 1985
0.042
+0.0
0.0%
jan 1, 1986
0.042
+0.0
0.0%
jan 1, 1987
0.747
+0.705
1.66K%
jan 1, 1988
0.697
-0.05
-6.68%
jan 1, 1989
0.0
-0.697
-100.0%
jan 1, 1990
0.012
+0.012
%
jan 1, 1991
0.064
+0.052
439.24%
jan 1, 1992
0.074
+0.01
15.36%
jan 1, 1993
0.366
+0.292
396.54%
jan 1, 1994
0.465
+0.099
27.01%
jan 1, 1995
0.299
-0.166
-35.63%
jan 1, 1996
0.648
+0.349
116.65%
jan 1, 1997
0.648
+0.0
0.01%
jan 1, 1998
0.477
-0.171
-26.43%
jan 1, 1999
0.006
-0.471
-98.7%
jan 1, 2000
0.181
+0.175
2.82K%
jan 1, 2001
0.078
-0.103
-56.88%
jan 1, 2002
0.079
+0.001
0.94%
jan 1, 2003
0.043
-0.035
-45.05%
jan 1, 2004
0.057
+0.014
31.44%
jan 1, 2005
0.062
+0.005
9.57%
jan 1, 2006
0.042
-0.02
-32.24%
jan 1, 2007
0.245
+0.202
479.76%
jan 1, 2008
2.023
+1.778
727.18%
jan 1, 2009
1.128
-0.895
-44.22%
jan 1, 2010
1.386
+0.257
22.81%
jan 1, 2011
1.708
+0.322
23.22%
jan 1, 2012
1.999
+0.291
17.06%
jan 1, 2013
2.367
+0.368
18.42%
jan 1, 2014
2.455
+0.088
3.72%
jan 1, 2015
0.396
-2.059
-83.85%
Ranking of countries by current statistics by years


Comments: