29
/
en
AIzaSyAYiBZKx7MnpbEhh9jyipgxe19OcubqV5w
April 1, 2024
219835
Papua New Guinea
PNG
true
2
1
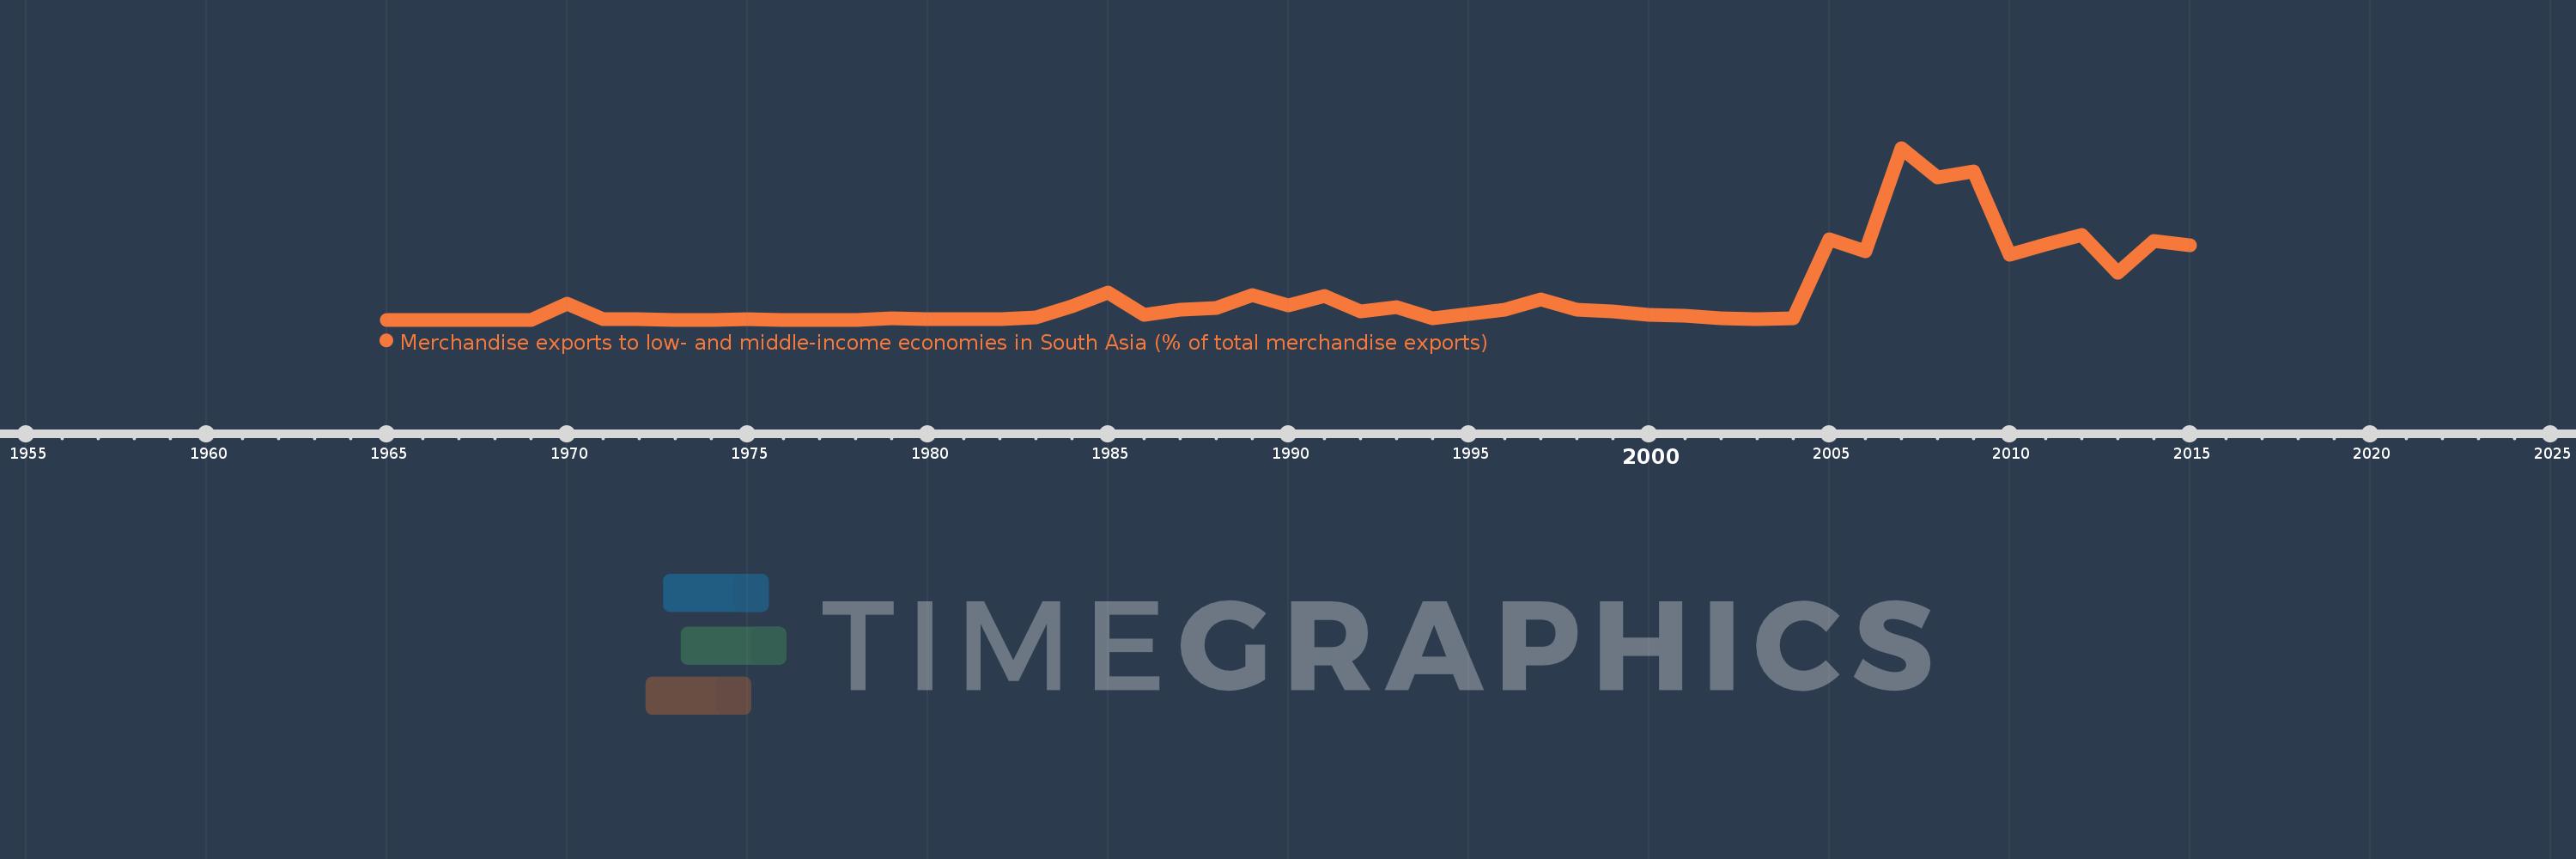
Merchandise exports to low- and middle-income economies in South Asia (% of total merchandise exports)
2015,2014,2013,2012,2011,2010,2009,2008,2007,2006,2005,2004,2003,2002,2001,2000,1999,1998,1997,1996,1995,1994,1993,1992,1991,1990,1989,1988,1987,1986,1985,1984,1983,1982,1981,1980,1979,1978,1977,1976,1975,1974,1973,1972,1971,1970,1969,1968,1967,1966,1965
This statistics in other country:
AfghanistanAlbaniaAlgeriaAngolaAntigua and BarbudaArab WorldArgentinaArmeniaArubaAustraliaAustriaAzerbaijanBahamas, TheBahrainBangladeshBarbadosBelarusBelgiumBelizeBeninBermudaBoliviaBrazilBrunei DarussalamBulgariaBurkina FasoBurundiCabo VerdeCambodiaCameroonCanadaCaribbean small statesCentral African RepublicCentral Europe and the BalticsChadChileChinaColombiaCongo, Rep.Costa RicaCote d'IvoireCroatiaCyprusCzech RepublicDenmarkDjiboutiDominicaDominican RepublicEarly-demographic dividendEast Asia & PacificEast Asia & Pacific (excluding high income)East Asia & Pacific (IDA & IBRD countries)EcuadorEgypt, Arab Rep.El SalvadorEstoniaEthiopiaEuro areaEurope & Central AsiaEurope & Central Asia (excluding high income)Europe & Central Asia (IDA & IBRD countries)European UnionFaroe IslandsFijiFinlandFragile and conflict affected situationsFranceGabonGambia, TheGeorgiaGermanyGhanaGibraltarGreeceGreenlandGrenadaGuatemalaGuineaGuyanaHaitiHeavily indebted poor countries (HIPC)High incomeHondurasHong Kong SAR, ChinaHungaryIBRD onlyIcelandIDA & IBRD totalIDA blendIDA onlyIDA totalIndiaIndonesiaIran, Islamic Rep.IraqIrelandIsraelItalyJamaicaJapanJordanKazakhstanKenyaKiribatiKorea, Dem. People’s Rep.Korea, Rep.KosovoKuwaitKyrgyz RepublicLao PDRLate-demographic dividendLatin America & Caribbean Latin America & Caribbean (excluding high income)Latin America & the Caribbean (IDA & IBRD countries)LatviaLeast developed countries: UN classificationLebanonLiberiaLibyaLithuaniaLow & middle incomeLow incomeLower middle incomeLuxembourgMacao SAR, ChinaMacedonia, FYRMadagascarMalawiMalaysiaMaldivesMaliMaltaMauritaniaMauritiusMexicoMiddle East & North AfricaMiddle East & North Africa (excluding high income)Middle East & North Africa (IDA & IBRD countries)Middle incomeMoldovaMongoliaMontenegroMoroccoMozambiqueMyanmarNauruNepalNetherlandsNew CaledoniaNew ZealandNicaraguaNigerNigeriaNorth AmericaNorwayOECD membersOmanOther small statesPacific island small statesPakistanPanamaPapua New GuineaParaguayPeruPhilippinesPolandPortugalPost-demographic dividendPre-demographic dividendQatarRomaniaRussian FederationRwandaSamoaSaudi ArabiaSenegalSerbiaSeychellesSierra LeoneSingaporeSlovak RepublicSloveniaSmall statesSomaliaSouth AfricaSouth AsiaSouth Asia (IDA & IBRD)SpainSri LankaSt. LuciaSt. Vincent and the GrenadinesSub-Saharan Africa Sub-Saharan Africa (excluding high income)Sub-Saharan Africa (IDA & IBRD countries)SudanSurinameSwedenSwitzerlandSyrian Arab RepublicTajikistanTanzaniaThailandTogoTongaTrinidad and TobagoTunisiaTurkeyTurkmenistanUgandaUkraineUnited Arab EmiratesUnited KingdomUnited StatesUpper middle incomeUruguayVanuatuVenezuela, RBVietnamWorldYemen, Rep.ZambiaZimbabwe Timeline:
This timeline shows a graph from 1965 to 2015 of Papua New Guinea. No data until 1964. Number of actual observations by date: 51.
Source name:
World Development Indicators
Source organization:
World Bank staff estimates based data from International Monetary Fund's Direction of Trade database.
Categories, topics:
Private Sector, Trade
Last updated:
apr 23, 2017
Indicators value changes by year
At the date of observation
Value
Absolute change
Change from previous value
jan 1, 1970
0.298
+0.298
%
jan 1, 1971
0.016
-0.282
-94.57%
jan 1, 1972
0.006
-0.01
-63.86%
jan 1, 1973
0.0
-0.006
-100.0%
jan 1, 1975
0.012
+0.012
%
jan 1, 1976
0.001
-0.012
-93.23%
jan 1, 1977
0.0
-0.001
-100.0%
jan 1, 1979
0.026
+0.026
%
jan 1, 1980
0.007
-0.019
-74.04%
jan 1, 1981
0.006
-0.001
-11.48%
jan 1, 1982
0.006
0.0
-5.28%
jan 1, 1983
0.049
+0.043
770.86%
jan 1, 1984
0.251
+0.202
413.98%
jan 1, 1985
0.499
+0.249
99.24%
jan 1, 1986
0.082
-0.417
-83.57%
jan 1, 1987
0.185
+0.103
126.04%
jan 1, 1988
0.221
+0.036
19.37%
jan 1, 1989
0.451
+0.23
103.66%
jan 1, 1990
0.261
-0.189
-42.02%
jan 1, 1991
0.429
+0.168
64.13%
jan 1, 1992
0.154
-0.276
-64.22%
jan 1, 1993
0.239
+0.085
55.55%
jan 1, 1994
0.03
-0.209
-87.4%
jan 1, 1995
0.11
+0.08
265.36%
jan 1, 1996
0.189
+0.079
71.54%
jan 1, 1997
0.37
+0.181
96.0%
jan 1, 1998
0.181
-0.189
-51.13%
jan 1, 1999
0.158
-0.023
-12.63%
jan 1, 2000
0.092
-0.066
-42.0%
jan 1, 2001
0.081
-0.011
-11.87%
jan 1, 2002
0.034
-0.046
-57.59%
jan 1, 2003
0.012
-0.022
-65.28%
jan 1, 2004
0.027
+0.015
124.07%
jan 1, 2005
1.483
+1.457
5.47K%
jan 1, 2006
1.25
-0.233
-15.73%
jan 1, 2007
3.149
+1.899
151.9%
jan 1, 2008
2.611
-0.538
-17.09%
jan 1, 2009
2.719
+0.108
4.15%
jan 1, 2010
1.187
-1.532
-56.35%
jan 1, 2011
1.385
+0.198
16.68%
jan 1, 2012
1.55
+0.165
11.94%
jan 1, 2013
0.86
-0.69
-44.53%
jan 1, 2014
1.449
+0.589
68.48%
jan 1, 2015
1.359
-0.09
-6.2%
Ranking of countries by current statistics by years


Comments: