29
/
en
AIzaSyAYiBZKx7MnpbEhh9jyipgxe19OcubqV5w
April 1, 2024
47347
Lower middle income
LMC
false
2
1
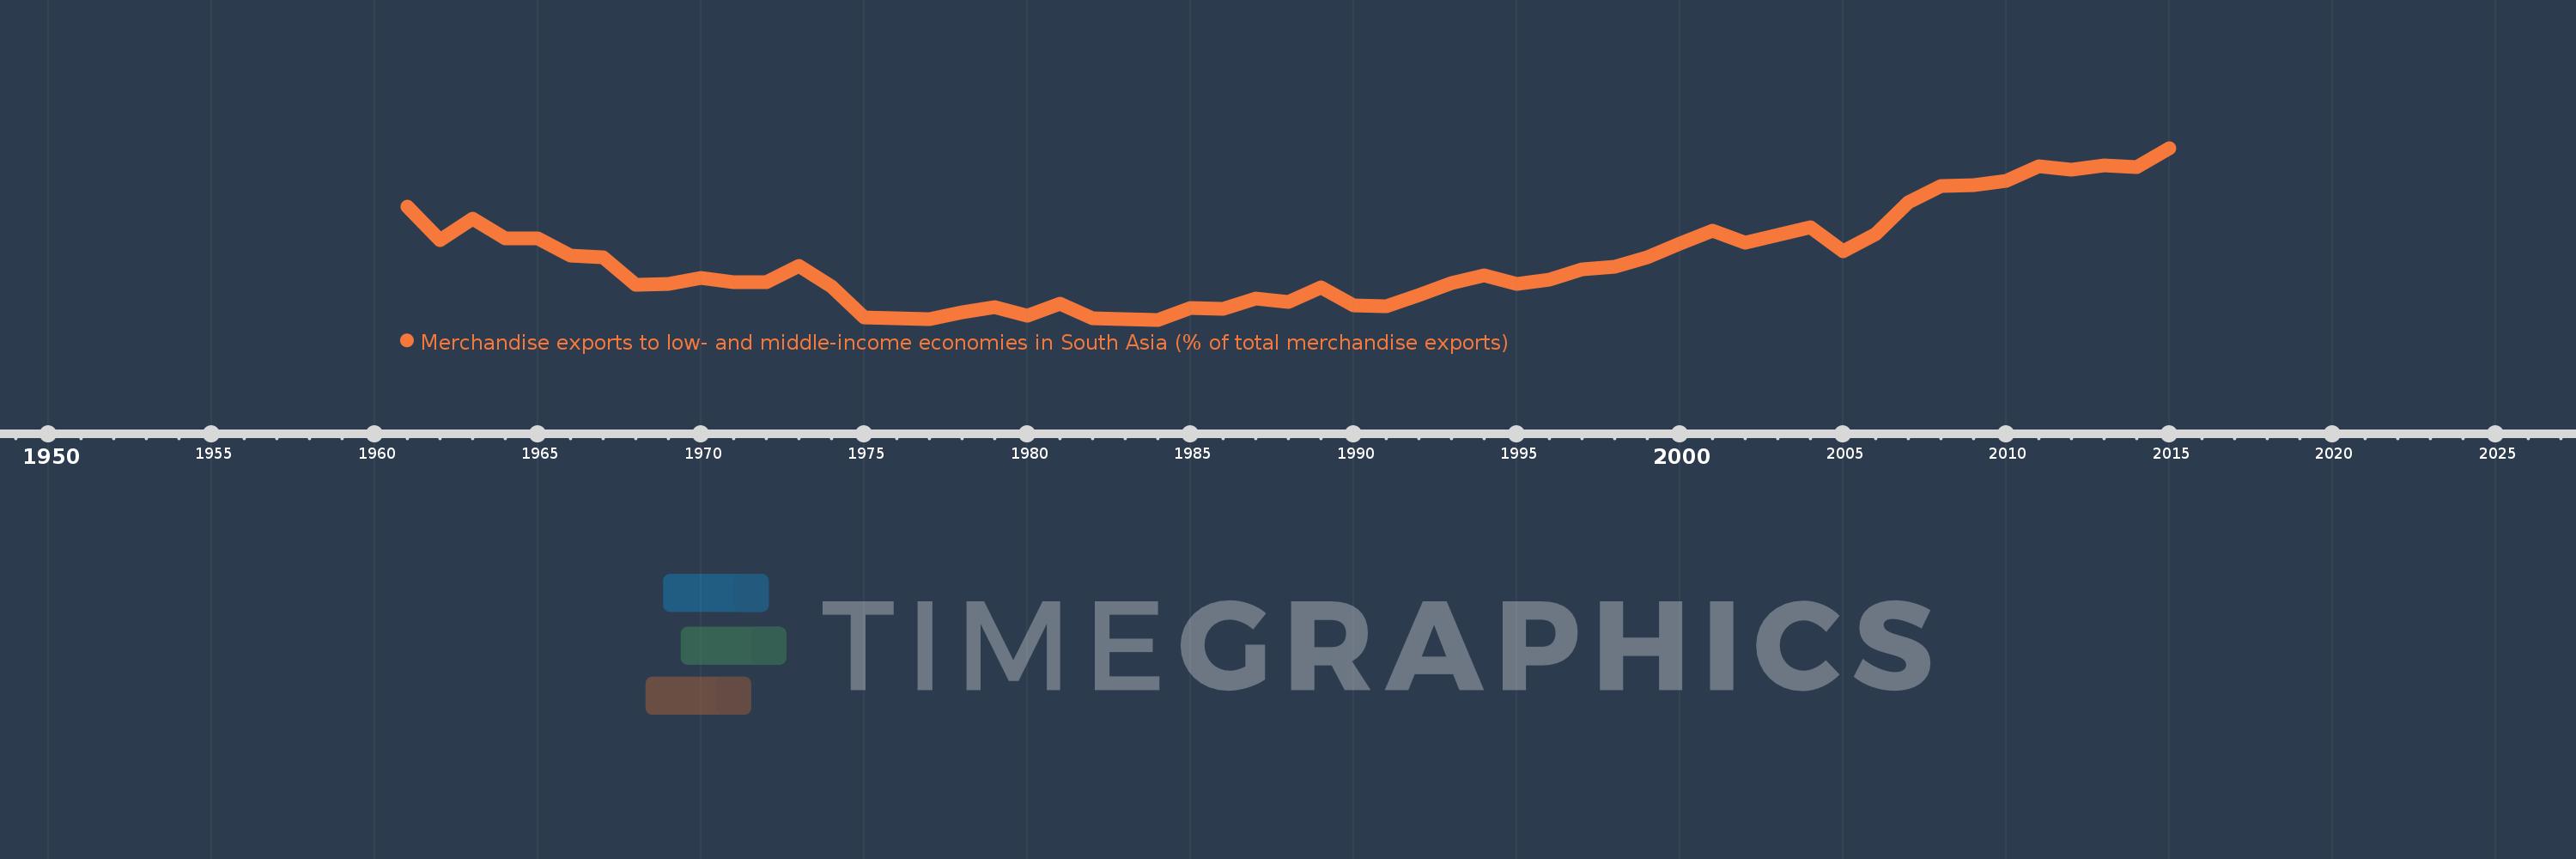
Merchandise exports to low- and middle-income economies in South Asia (% of total merchandise exports)
2015,2014,2013,2012,2011,2010,2009,2008,2007,2006,2005,2004,2003,2002,2001,2000,1999,1998,1997,1996,1995,1994,1993,1992,1991,1990,1989,1988,1987,1986,1985,1984,1983,1982,1981,1980,1979,1978,1977,1976,1975,1974,1973,1972,1971,1970,1969,1968,1967,1966,1965,1964,1963,1962,1961
This statistics in other country:
AfghanistanAlbaniaAlgeriaAngolaAntigua and BarbudaArab WorldArgentinaArmeniaArubaAustraliaAustriaAzerbaijanBahamas, TheBahrainBangladeshBarbadosBelarusBelgiumBelizeBeninBermudaBoliviaBrazilBrunei DarussalamBulgariaBurkina FasoBurundiCabo VerdeCambodiaCameroonCanadaCaribbean small statesCentral African RepublicCentral Europe and the BalticsChadChileChinaColombiaCongo, Rep.Costa RicaCote d'IvoireCroatiaCyprusCzech RepublicDenmarkDjiboutiDominicaDominican RepublicEarly-demographic dividendEast Asia & PacificEast Asia & Pacific (excluding high income)East Asia & Pacific (IDA & IBRD countries)EcuadorEgypt, Arab Rep.El SalvadorEstoniaEthiopiaEuro areaEurope & Central AsiaEurope & Central Asia (excluding high income)Europe & Central Asia (IDA & IBRD countries)European UnionFaroe IslandsFijiFinlandFragile and conflict affected situationsFranceGabonGambia, TheGeorgiaGermanyGhanaGibraltarGreeceGreenlandGrenadaGuatemalaGuineaGuyanaHaitiHeavily indebted poor countries (HIPC)High incomeHondurasHong Kong SAR, ChinaHungaryIBRD onlyIcelandIDA & IBRD totalIDA blendIDA onlyIDA totalIndiaIndonesiaIran, Islamic Rep.IraqIrelandIsraelItalyJamaicaJapanJordanKazakhstanKenyaKiribatiKorea, Dem. People’s Rep.Korea, Rep.KosovoKuwaitKyrgyz RepublicLao PDRLate-demographic dividendLatin America & Caribbean Latin America & Caribbean (excluding high income)Latin America & the Caribbean (IDA & IBRD countries)LatviaLeast developed countries: UN classificationLebanonLiberiaLibyaLithuaniaLow & middle incomeLow incomeLower middle incomeLuxembourgMacao SAR, ChinaMacedonia, FYRMadagascarMalawiMalaysiaMaldivesMaliMaltaMauritaniaMauritiusMexicoMiddle East & North AfricaMiddle East & North Africa (excluding high income)Middle East & North Africa (IDA & IBRD countries)Middle incomeMoldovaMongoliaMontenegroMoroccoMozambiqueMyanmarNauruNepalNetherlandsNew CaledoniaNew ZealandNicaraguaNigerNigeriaNorth AmericaNorwayOECD membersOmanOther small statesPacific island small statesPakistanPanamaPapua New GuineaParaguayPeruPhilippinesPolandPortugalPost-demographic dividendPre-demographic dividendQatarRomaniaRussian FederationRwandaSamoaSaudi ArabiaSenegalSerbiaSeychellesSierra LeoneSingaporeSlovak RepublicSloveniaSmall statesSomaliaSouth AfricaSouth AsiaSouth Asia (IDA & IBRD)SpainSri LankaSt. LuciaSt. Vincent and the GrenadinesSub-Saharan Africa Sub-Saharan Africa (excluding high income)Sub-Saharan Africa (IDA & IBRD countries)SudanSurinameSwedenSwitzerlandSyrian Arab RepublicTajikistanTanzaniaThailandTogoTongaTrinidad and TobagoTunisiaTurkeyTurkmenistanUgandaUkraineUnited Arab EmiratesUnited KingdomUnited StatesUpper middle incomeUruguayVanuatuVenezuela, RBVietnamWorldYemen, Rep.ZambiaZimbabwe Timeline:
This timeline shows a graph from 1961 to 2015 of Lower middle income. No data until 1960. Number of actual observations by date: 55.
Source name:
World Development Indicators
Source organization:
World Bank staff estimates based data from International Monetary Fund's Direction of Trade database.
Categories, topics:
Private Sector, Trade
Last updated:
apr 23, 2017
Indicators value changes by year
At the date of observation
Value
Absolute change
Change from previous value
jan 1, 1961
4.367
+4.367
0.0%
jan 1, 1962
3.44
-0.927
-21.24%
jan 1, 1963
4.04
+0.601
17.46%
jan 1, 1964
3.489
-0.551
-13.65%
jan 1, 1965
3.483
-0.006
-0.17%
jan 1, 1966
3.005
-0.478
-13.73%
jan 1, 1967
2.944
-0.061
-2.03%
jan 1, 1968
2.185
-0.759
-25.77%
jan 1, 1969
2.217
+0.032
1.44%
jan 1, 1970
2.373
+0.156
7.05%
jan 1, 1971
2.266
-0.107
-4.5%
jan 1, 1972
2.264
-0.002
-0.09%
jan 1, 1973
2.72
+0.455
20.11%
jan 1, 1974
2.137
-0.583
-21.42%
jan 1, 1975
1.279
-0.858
-40.16%
jan 1, 1976
1.256
-0.023
-1.8%
jan 1, 1977
1.217
-0.039
-3.11%
jan 1, 1978
1.426
+0.209
17.19%
jan 1, 1979
1.552
+0.126
8.85%
jan 1, 1980
1.319
-0.233
-15.04%
jan 1, 1981
1.649
+0.33
25.03%
jan 1, 1982
1.254
-0.395
-23.96%
jan 1, 1983
1.21
-0.043
-3.47%
jan 1, 1984
1.205
-0.006
-0.47%
jan 1, 1985
1.532
+0.327
27.18%
jan 1, 1986
1.504
-0.028
-1.84%
jan 1, 1987
1.793
+0.289
19.23%
jan 1, 1988
1.708
-0.085
-4.76%
jan 1, 1989
2.121
+0.413
24.21%
jan 1, 1990
1.603
-0.518
-24.41%
jan 1, 1991
1.573
-0.03
-1.88%
jan 1, 1992
1.887
+0.314
19.94%
jan 1, 1993
2.232
+0.345
18.29%
jan 1, 1994
2.45
+0.217
9.74%
jan 1, 1995
2.197
-0.252
-10.3%
jan 1, 1996
2.332
+0.134
6.11%
jan 1, 1997
2.618
+0.287
12.29%
jan 1, 1998
2.686
+0.068
2.6%
jan 1, 1999
2.944
+0.258
9.6%
jan 1, 2000
3.348
+0.404
13.71%
jan 1, 2001
3.7
+0.352
10.52%
jan 1, 2002
3.355
-0.345
-9.33%
jan 1, 2003
3.578
+0.223
6.66%
jan 1, 2004
3.803
+0.224
6.27%
jan 1, 2005
3.129
-0.674
-17.72%
jan 1, 2006
3.603
+0.474
15.15%
jan 1, 2007
4.482
+0.879
24.4%
jan 1, 2008
4.96
+0.478
10.66%
jan 1, 2009
4.982
+0.022
0.44%
jan 1, 2010
5.099
+0.117
2.35%
jan 1, 2011
5.502
+0.403
7.91%
jan 1, 2012
5.405
-0.097
-1.76%
jan 1, 2013
5.519
+0.114
2.1%
jan 1, 2014
5.487
-0.032
-0.58%
jan 1, 2015
6.013
+0.527
9.6%
Ranking of countries by current statistics by years


Comments: