29
/
en
AIzaSyAYiBZKx7MnpbEhh9jyipgxe19OcubqV5w
April 1, 2024
40894
Late-demographic dividend
LTE
false
2
1
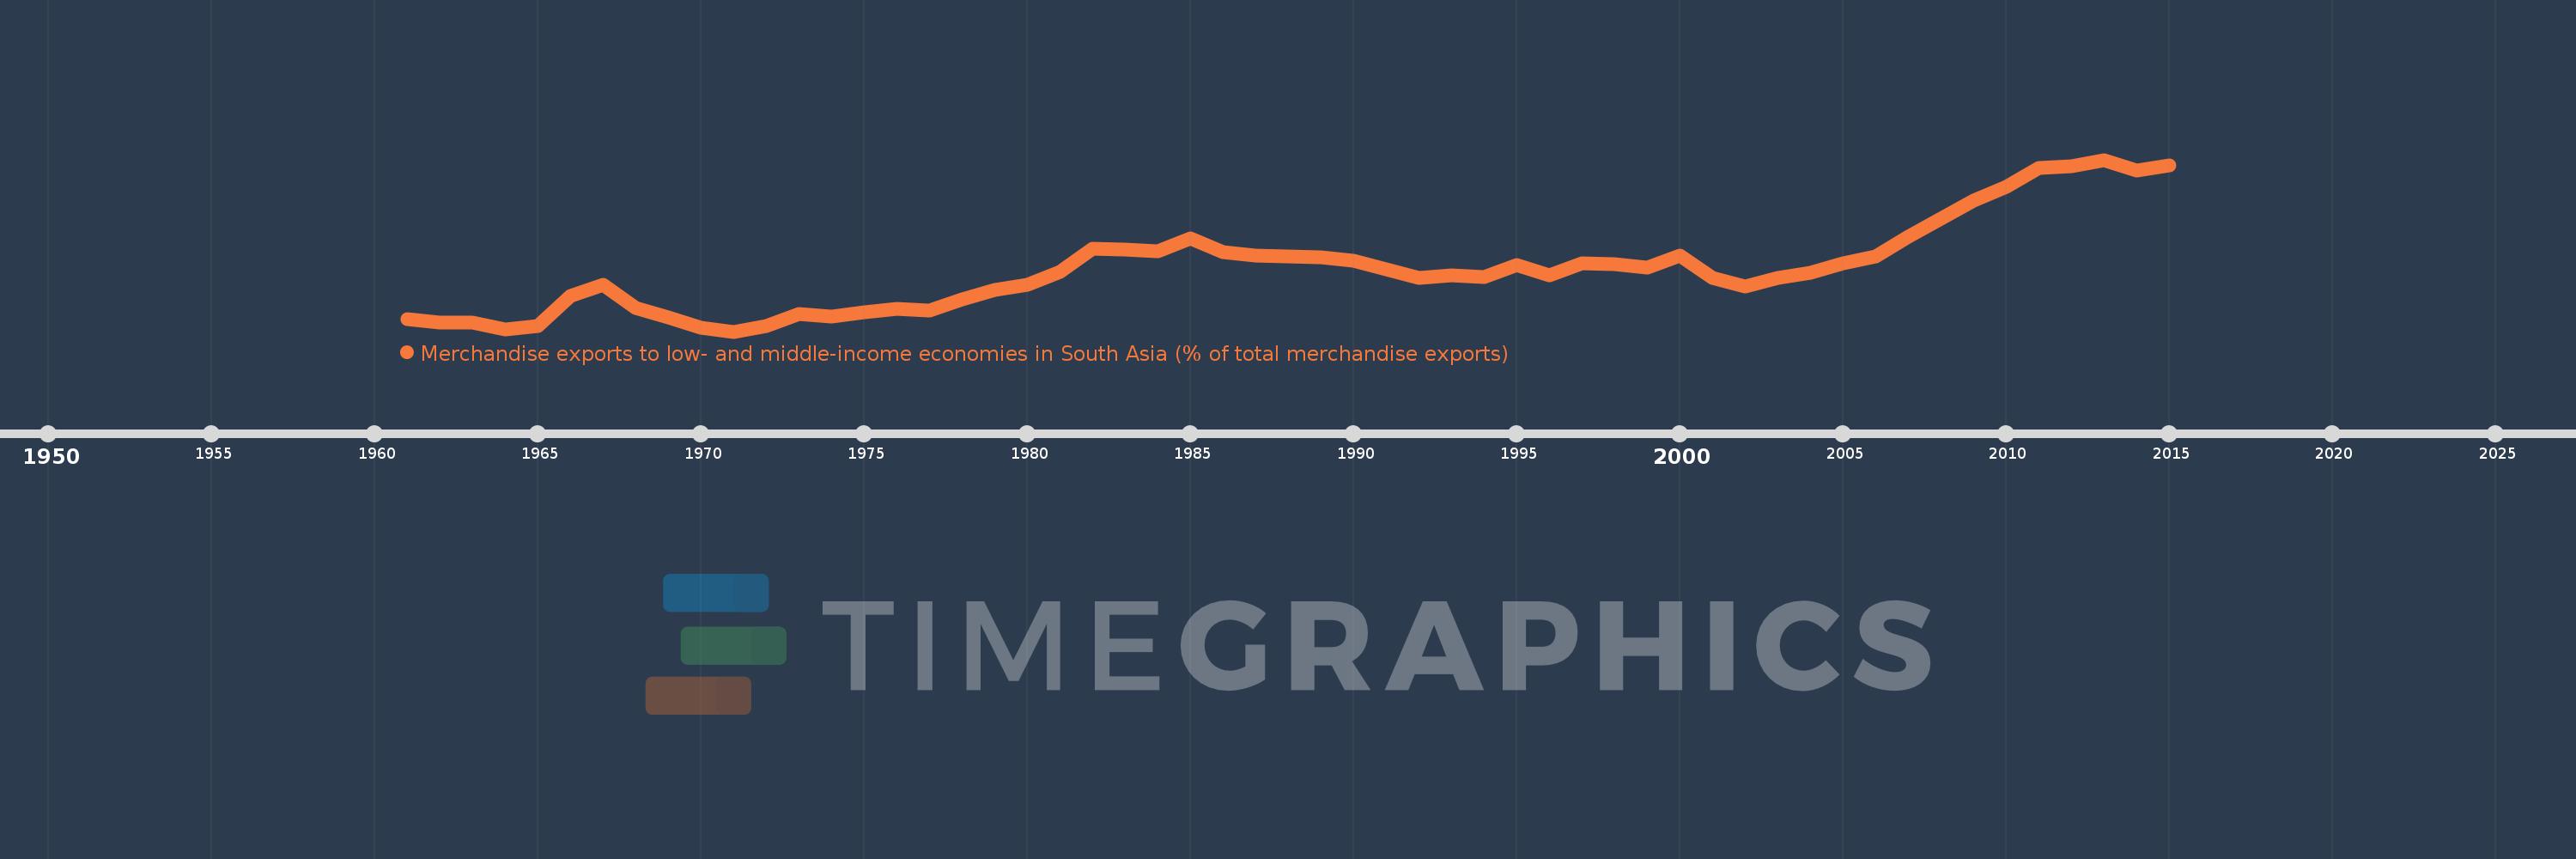
Merchandise exports to low- and middle-income economies in South Asia (% of total merchandise exports)
2015,2014,2013,2012,2011,2010,2009,2008,2007,2006,2005,2004,2003,2002,2001,2000,1999,1998,1997,1996,1995,1994,1993,1992,1991,1990,1989,1988,1987,1986,1985,1984,1983,1982,1981,1980,1979,1978,1977,1976,1975,1974,1973,1972,1971,1970,1969,1968,1967,1966,1965,1964,1963,1962,1961
This statistics in other country:
AfghanistanAlbaniaAlgeriaAngolaAntigua and BarbudaArab WorldArgentinaArmeniaArubaAustraliaAustriaAzerbaijanBahamas, TheBahrainBangladeshBarbadosBelarusBelgiumBelizeBeninBermudaBoliviaBrazilBrunei DarussalamBulgariaBurkina FasoBurundiCabo VerdeCambodiaCameroonCanadaCaribbean small statesCentral African RepublicCentral Europe and the BalticsChadChileChinaColombiaCongo, Rep.Costa RicaCote d'IvoireCroatiaCyprusCzech RepublicDenmarkDjiboutiDominicaDominican RepublicEarly-demographic dividendEast Asia & PacificEast Asia & Pacific (excluding high income)East Asia & Pacific (IDA & IBRD countries)EcuadorEgypt, Arab Rep.El SalvadorEstoniaEthiopiaEuro areaEurope & Central AsiaEurope & Central Asia (excluding high income)Europe & Central Asia (IDA & IBRD countries)European UnionFaroe IslandsFijiFinlandFragile and conflict affected situationsFranceGabonGambia, TheGeorgiaGermanyGhanaGibraltarGreeceGreenlandGrenadaGuatemalaGuineaGuyanaHaitiHeavily indebted poor countries (HIPC)High incomeHondurasHong Kong SAR, ChinaHungaryIBRD onlyIcelandIDA & IBRD totalIDA blendIDA onlyIDA totalIndiaIndonesiaIran, Islamic Rep.IraqIrelandIsraelItalyJamaicaJapanJordanKazakhstanKenyaKiribatiKorea, Dem. People’s Rep.Korea, Rep.KosovoKuwaitKyrgyz RepublicLao PDRLate-demographic dividendLatin America & Caribbean Latin America & Caribbean (excluding high income)Latin America & the Caribbean (IDA & IBRD countries)LatviaLeast developed countries: UN classificationLebanonLiberiaLibyaLithuaniaLow & middle incomeLow incomeLower middle incomeLuxembourgMacao SAR, ChinaMacedonia, FYRMadagascarMalawiMalaysiaMaldivesMaliMaltaMauritaniaMauritiusMexicoMiddle East & North AfricaMiddle East & North Africa (excluding high income)Middle East & North Africa (IDA & IBRD countries)Middle incomeMoldovaMongoliaMontenegroMoroccoMozambiqueMyanmarNauruNepalNetherlandsNew CaledoniaNew ZealandNicaraguaNigerNigeriaNorth AmericaNorwayOECD membersOmanOther small statesPacific island small statesPakistanPanamaPapua New GuineaParaguayPeruPhilippinesPolandPortugalPost-demographic dividendPre-demographic dividendQatarRomaniaRussian FederationRwandaSamoaSaudi ArabiaSenegalSerbiaSeychellesSierra LeoneSingaporeSlovak RepublicSloveniaSmall statesSomaliaSouth AfricaSouth AsiaSouth Asia (IDA & IBRD)SpainSri LankaSt. LuciaSt. Vincent and the GrenadinesSub-Saharan Africa Sub-Saharan Africa (excluding high income)Sub-Saharan Africa (IDA & IBRD countries)SudanSurinameSwedenSwitzerlandSyrian Arab RepublicTajikistanTanzaniaThailandTogoTongaTrinidad and TobagoTunisiaTurkeyTurkmenistanUgandaUkraineUnited Arab EmiratesUnited KingdomUnited StatesUpper middle incomeUruguayVanuatuVenezuela, RBVietnamWorldYemen, Rep.ZambiaZimbabwe Timeline:
This timeline shows a graph from 1961 to 2015 of Late-demographic dividend. No data until 1960. Number of actual observations by date: 55.
Source name:
World Development Indicators
Source organization:
World Bank staff estimates based data from International Monetary Fund's Direction of Trade database.
Categories, topics:
Private Sector, Trade
Last updated:
apr 23, 2017
Indicators value changes by year
At the date of observation
Value
Absolute change
Change from previous value
jan 1, 1961
0.807
+0.807
0.0%
jan 1, 1962
0.725
-0.082
-10.22%
jan 1, 1963
0.737
+0.012
1.68%
jan 1, 1964
0.578
-0.158
-21.48%
jan 1, 1965
0.66
+0.081
14.03%
jan 1, 1966
1.313
+0.653
99.04%
jan 1, 1967
1.551
+0.238
18.15%
jan 1, 1968
1.046
-0.505
-32.58%
jan 1, 1969
0.846
-0.2
-19.09%
jan 1, 1970
0.628
-0.218
-25.8%
jan 1, 1971
0.536
-0.092
-14.63%
jan 1, 1972
0.662
+0.126
23.55%
jan 1, 1973
0.913
+0.25
37.82%
jan 1, 1974
0.855
-0.057
-6.27%
jan 1, 1975
0.963
+0.107
12.55%
jan 1, 1976
1.031
+0.069
7.13%
jan 1, 1977
0.999
-0.033
-3.17%
jan 1, 1978
1.241
+0.242
24.26%
jan 1, 1979
1.432
+0.191
15.39%
jan 1, 1980
1.548
+0.116
8.11%
jan 1, 1981
1.822
+0.274
17.68%
jan 1, 1982
2.328
+0.507
27.81%
jan 1, 1983
2.307
-0.022
-0.92%
jan 1, 1984
2.277
-0.03
-1.29%
jan 1, 1985
2.548
+0.271
11.88%
jan 1, 1986
2.261
-0.287
-11.26%
jan 1, 1987
2.184
-0.076
-3.38%
jan 1, 1988
2.17
-0.015
-0.68%
jan 1, 1989
2.139
-0.03
-1.41%
jan 1, 1990
2.073
-0.066
-3.08%
jan 1, 1991
1.889
-0.184
-8.9%
jan 1, 1992
1.696
-0.193
-10.2%
jan 1, 1993
1.758
+0.062
3.67%
jan 1, 1994
1.708
-0.05
-2.87%
jan 1, 1995
1.968
+0.26
15.21%
jan 1, 1996
1.755
-0.213
-10.82%
jan 1, 1997
2.011
+0.256
14.6%
jan 1, 1998
1.987
-0.023
-1.16%
jan 1, 1999
1.919
-0.068
-3.44%
jan 1, 2000
2.182
+0.263
13.71%
jan 1, 2001
1.693
-0.489
-22.42%
jan 1, 2002
1.52
-0.173
-10.21%
jan 1, 2003
1.697
+0.177
11.65%
jan 1, 2004
1.804
+0.106
6.27%
jan 1, 2005
2.022
+0.219
12.12%
jan 1, 2006
2.158
+0.136
6.72%
jan 1, 2007
2.584
+0.426
19.76%
jan 1, 2008
2.98
+0.395
15.3%
jan 1, 2009
3.373
+0.394
13.21%
jan 1, 2010
3.664
+0.29
8.6%
jan 1, 2011
4.071
+0.407
11.12%
jan 1, 2012
4.122
+0.051
1.26%
jan 1, 2013
4.253
+0.131
3.17%
jan 1, 2014
4.013
-0.24
-5.65%
jan 1, 2015
4.125
+0.112
2.79%
Ranking of countries by current statistics by years


Comments: