29
/
en
AIzaSyAYiBZKx7MnpbEhh9jyipgxe19OcubqV5w
April 1, 2024
201859
Morocco
MAR
true
2
1
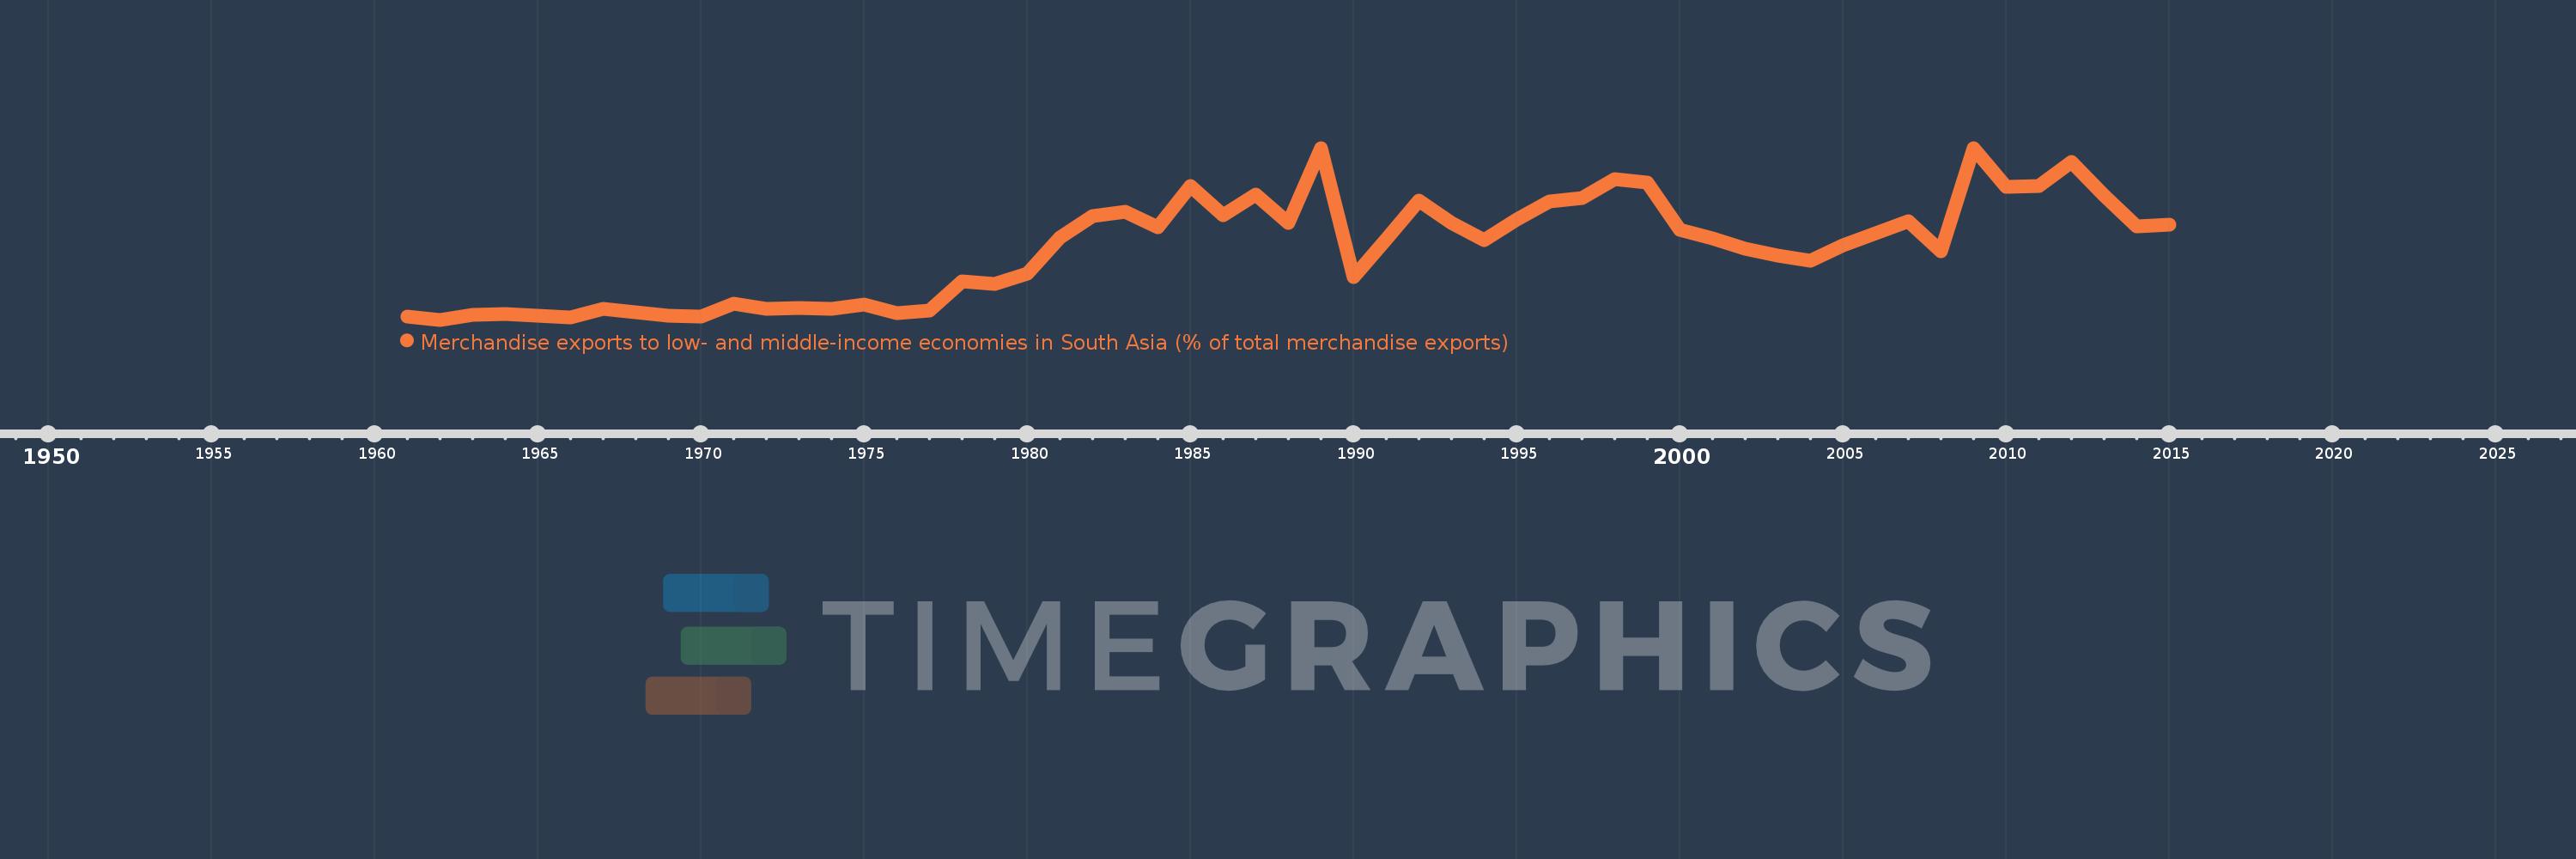
Merchandise exports to low- and middle-income economies in South Asia (% of total merchandise exports)
2015,2014,2013,2012,2011,2010,2009,2008,2007,2006,2005,2004,2003,2002,2001,2000,1999,1998,1997,1996,1995,1994,1993,1992,1991,1990,1989,1988,1987,1986,1985,1984,1983,1982,1981,1980,1979,1978,1977,1976,1975,1974,1973,1972,1971,1970,1969,1968,1967,1966,1965,1964,1963,1962,1961
This statistics in other country:
AfghanistanAlbaniaAlgeriaAngolaAntigua and BarbudaArab WorldArgentinaArmeniaArubaAustraliaAustriaAzerbaijanBahamas, TheBahrainBangladeshBarbadosBelarusBelgiumBelizeBeninBermudaBoliviaBrazilBrunei DarussalamBulgariaBurkina FasoBurundiCabo VerdeCambodiaCameroonCanadaCaribbean small statesCentral African RepublicCentral Europe and the BalticsChadChileChinaColombiaCongo, Rep.Costa RicaCote d'IvoireCroatiaCyprusCzech RepublicDenmarkDjiboutiDominicaDominican RepublicEarly-demographic dividendEast Asia & PacificEast Asia & Pacific (excluding high income)East Asia & Pacific (IDA & IBRD countries)EcuadorEgypt, Arab Rep.El SalvadorEstoniaEthiopiaEuro areaEurope & Central AsiaEurope & Central Asia (excluding high income)Europe & Central Asia (IDA & IBRD countries)European UnionFaroe IslandsFijiFinlandFragile and conflict affected situationsFranceGabonGambia, TheGeorgiaGermanyGhanaGibraltarGreeceGreenlandGrenadaGuatemalaGuineaGuyanaHaitiHeavily indebted poor countries (HIPC)High incomeHondurasHong Kong SAR, ChinaHungaryIBRD onlyIcelandIDA & IBRD totalIDA blendIDA onlyIDA totalIndiaIndonesiaIran, Islamic Rep.IraqIrelandIsraelItalyJamaicaJapanJordanKazakhstanKenyaKiribatiKorea, Dem. People’s Rep.Korea, Rep.KosovoKuwaitKyrgyz RepublicLao PDRLate-demographic dividendLatin America & Caribbean Latin America & Caribbean (excluding high income)Latin America & the Caribbean (IDA & IBRD countries)LatviaLeast developed countries: UN classificationLebanonLiberiaLibyaLithuaniaLow & middle incomeLow incomeLower middle incomeLuxembourgMacao SAR, ChinaMacedonia, FYRMadagascarMalawiMalaysiaMaldivesMaliMaltaMauritaniaMauritiusMexicoMiddle East & North AfricaMiddle East & North Africa (excluding high income)Middle East & North Africa (IDA & IBRD countries)Middle incomeMoldovaMongoliaMontenegroMoroccoMozambiqueMyanmarNauruNepalNetherlandsNew CaledoniaNew ZealandNicaraguaNigerNigeriaNorth AmericaNorwayOECD membersOmanOther small statesPacific island small statesPakistanPanamaPapua New GuineaParaguayPeruPhilippinesPolandPortugalPost-demographic dividendPre-demographic dividendQatarRomaniaRussian FederationRwandaSamoaSaudi ArabiaSenegalSerbiaSeychellesSierra LeoneSingaporeSlovak RepublicSloveniaSmall statesSomaliaSouth AfricaSouth AsiaSouth Asia (IDA & IBRD)SpainSri LankaSt. LuciaSt. Vincent and the GrenadinesSub-Saharan Africa Sub-Saharan Africa (excluding high income)Sub-Saharan Africa (IDA & IBRD countries)SudanSurinameSwedenSwitzerlandSyrian Arab RepublicTajikistanTanzaniaThailandTogoTongaTrinidad and TobagoTunisiaTurkeyTurkmenistanUgandaUkraineUnited Arab EmiratesUnited KingdomUnited StatesUpper middle incomeUruguayVanuatuVenezuela, RBVietnamWorldYemen, Rep.ZambiaZimbabwe Timeline:
This timeline shows a graph from 1961 to 2015 of Morocco. No data until 1960. Number of actual observations by date: 55.
Source name:
World Development Indicators
Source organization:
World Bank staff estimates based data from International Monetary Fund's Direction of Trade database.
Categories, topics:
Private Sector, Trade
Last updated:
apr 23, 2017
Indicators value changes by year
At the date of observation
Value
Absolute change
Change from previous value
jan 1, 1961
0.284
+0.284
0.0%
jan 1, 1962
0.117
-0.167
-58.77%
jan 1, 1963
0.376
+0.259
221.8%
jan 1, 1964
0.446
+0.07
18.52%
jan 1, 1965
0.349
-0.098
-21.86%
jan 1, 1966
0.256
-0.092
-26.5%
jan 1, 1967
0.699
+0.443
172.66%
jan 1, 1968
0.542
-0.156
-22.38%
jan 1, 1969
0.317
-0.225
-41.5%
jan 1, 1970
0.316
-0.002
-0.52%
jan 1, 1971
0.998
+0.682
216.17%
jan 1, 1972
0.709
-0.289
-28.99%
jan 1, 1973
0.767
+0.058
8.2%
jan 1, 1974
0.729
-0.038
-4.91%
jan 1, 1975
0.962
+0.233
31.91%
jan 1, 1976
0.483
-0.479
-49.83%
jan 1, 1977
0.644
+0.162
33.51%
jan 1, 1978
2.252
+1.607
249.4%
jan 1, 1979
2.098
-0.153
-6.81%
jan 1, 1980
2.691
+0.593
28.27%
jan 1, 1981
4.647
+1.956
72.68%
jan 1, 1982
5.832
+1.185
25.5%
jan 1, 1983
6.106
+0.274
4.7%
jan 1, 1984
5.232
-0.874
-14.31%
jan 1, 1985
7.534
+2.302
43.99%
jan 1, 1986
5.879
-1.656
-21.97%
jan 1, 1987
7.037
+1.158
19.7%
jan 1, 1988
5.478
-1.559
-22.15%
jan 1, 1989
9.622
+4.144
75.65%
jan 1, 1990
2.483
-7.139
-74.19%
jan 1, 1991
4.586
+2.103
84.68%
jan 1, 1992
6.712
+2.126
46.35%
jan 1, 1993
5.479
-1.232
-18.36%
jan 1, 1994
4.544
-0.935
-17.07%
jan 1, 1995
5.64
+1.096
24.11%
jan 1, 1996
6.673
+1.033
18.32%
jan 1, 1997
6.868
+0.196
2.93%
jan 1, 1998
7.882
+1.014
14.76%
jan 1, 1999
7.706
-0.176
-2.23%
jan 1, 2000
5.074
-2.632
-34.16%
jan 1, 2001
4.627
-0.448
-8.82%
jan 1, 2002
4.027
-0.6
-12.96%
jan 1, 2003
3.656
-0.371
-9.2%
jan 1, 2004
3.37
-0.287
-7.84%
jan 1, 2005
4.241
+0.871
25.85%
jan 1, 2006
4.896
+0.655
15.45%
jan 1, 2007
5.547
+0.651
13.31%
jan 1, 2008
3.892
-1.655
-29.84%
jan 1, 2009
9.623
+5.731
147.24%
jan 1, 2010
7.448
-2.175
-22.6%
jan 1, 2011
7.505
+0.057
0.76%
jan 1, 2012
8.843
+1.338
17.83%
jan 1, 2013
7.011
-1.832
-20.71%
jan 1, 2014
5.28
-1.731
-24.69%
jan 1, 2015
5.399
+0.119
2.26%
Ranking of countries by current statistics by years


Comments: