29
/
en
AIzaSyAYiBZKx7MnpbEhh9jyipgxe19OcubqV5w
April 1, 2024
144664
Guatemala
GTM
true
2
1
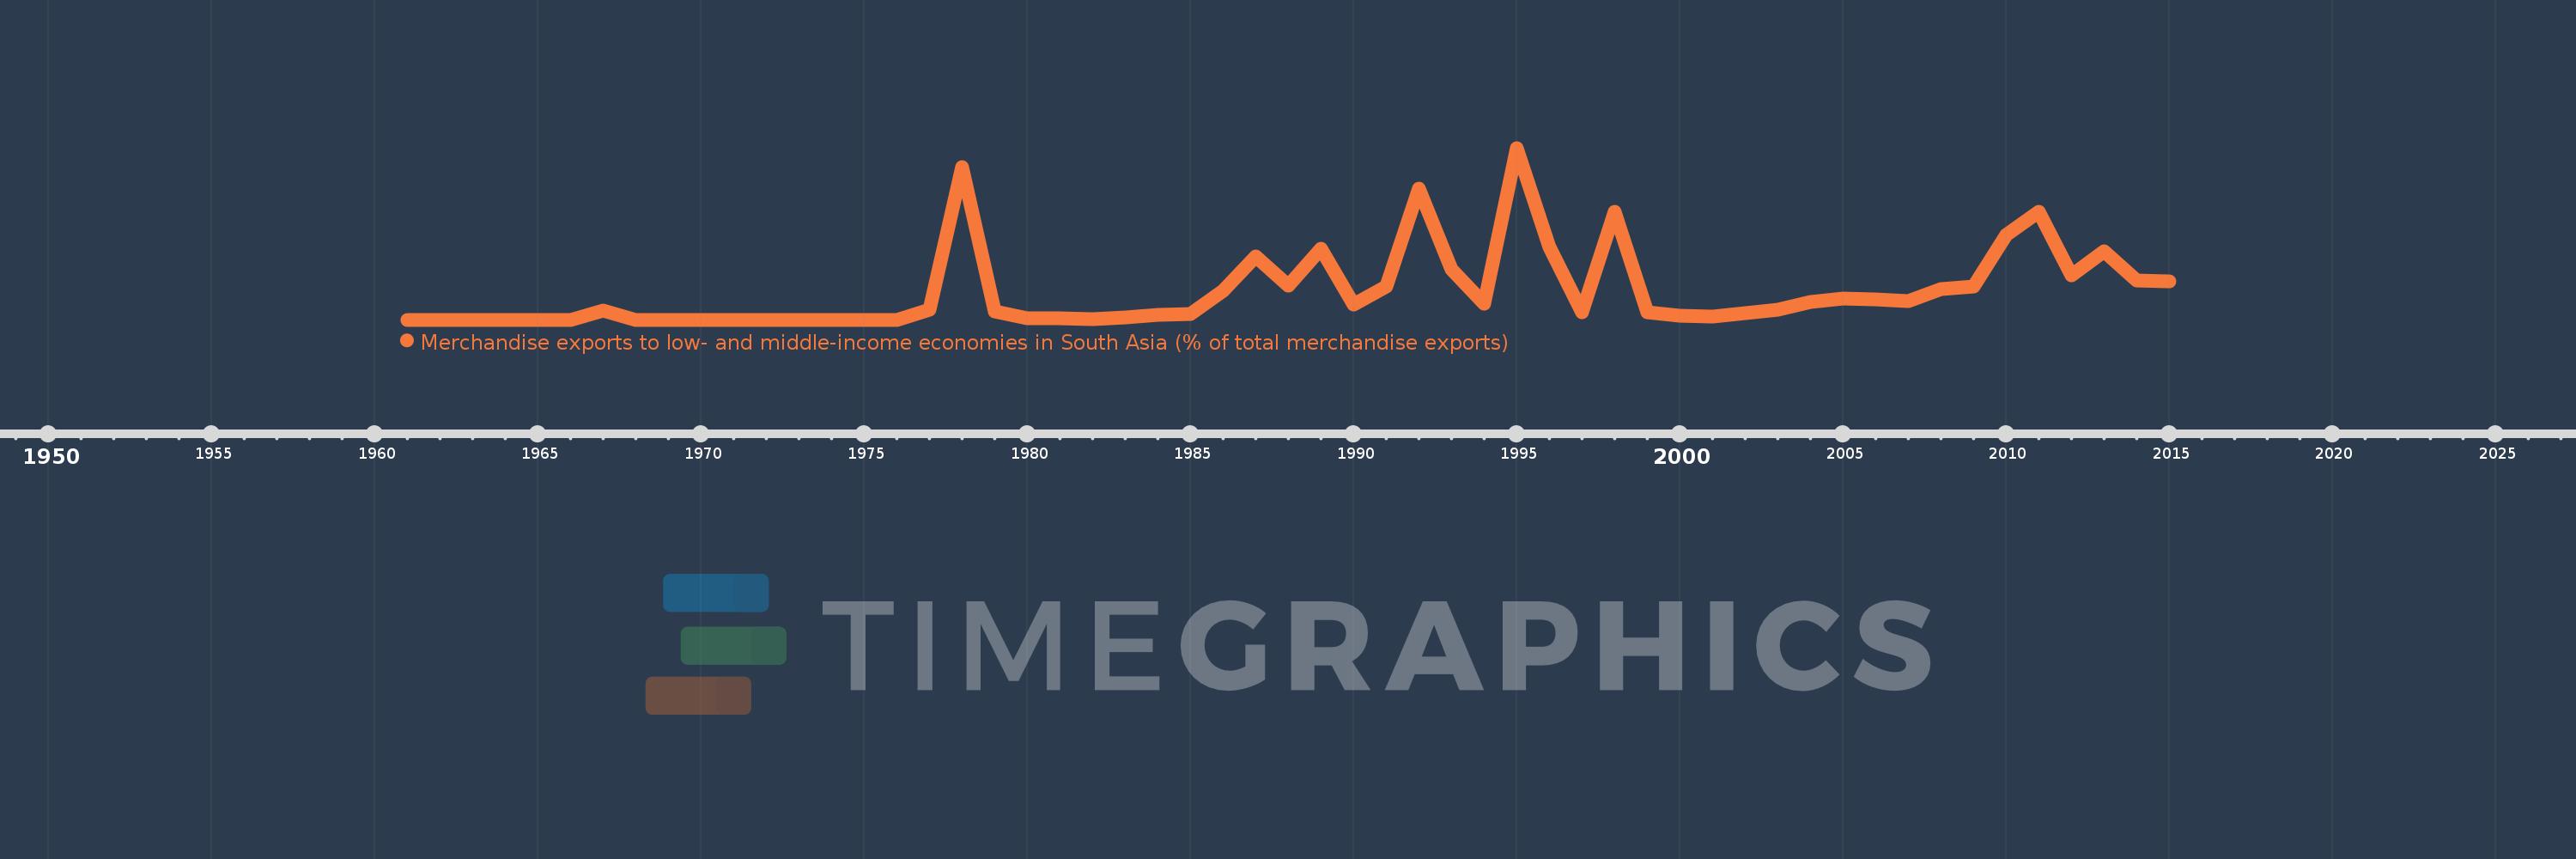
Merchandise exports to low- and middle-income economies in South Asia (% of total merchandise exports)
2015,2014,2013,2012,2011,2010,2009,2008,2007,2006,2005,2004,2003,2002,2001,2000,1999,1998,1997,1996,1995,1994,1993,1992,1991,1990,1989,1988,1987,1986,1985,1984,1983,1982,1981,1980,1979,1978,1977,1976,1975,1974,1973,1972,1971,1970,1969,1968,1967,1966,1965,1964,1963,1962,1961
This statistics in other country:
AfghanistanAlbaniaAlgeriaAngolaAntigua and BarbudaArab WorldArgentinaArmeniaArubaAustraliaAustriaAzerbaijanBahamas, TheBahrainBangladeshBarbadosBelarusBelgiumBelizeBeninBermudaBoliviaBrazilBrunei DarussalamBulgariaBurkina FasoBurundiCabo VerdeCambodiaCameroonCanadaCaribbean small statesCentral African RepublicCentral Europe and the BalticsChadChileChinaColombiaCongo, Rep.Costa RicaCote d'IvoireCroatiaCyprusCzech RepublicDenmarkDjiboutiDominicaDominican RepublicEarly-demographic dividendEast Asia & PacificEast Asia & Pacific (excluding high income)East Asia & Pacific (IDA & IBRD countries)EcuadorEgypt, Arab Rep.El SalvadorEstoniaEthiopiaEuro areaEurope & Central AsiaEurope & Central Asia (excluding high income)Europe & Central Asia (IDA & IBRD countries)European UnionFaroe IslandsFijiFinlandFragile and conflict affected situationsFranceGabonGambia, TheGeorgiaGermanyGhanaGibraltarGreeceGreenlandGrenadaGuatemalaGuineaGuyanaHaitiHeavily indebted poor countries (HIPC)High incomeHondurasHong Kong SAR, ChinaHungaryIBRD onlyIcelandIDA & IBRD totalIDA blendIDA onlyIDA totalIndiaIndonesiaIran, Islamic Rep.IraqIrelandIsraelItalyJamaicaJapanJordanKazakhstanKenyaKiribatiKorea, Dem. People’s Rep.Korea, Rep.KosovoKuwaitKyrgyz RepublicLao PDRLate-demographic dividendLatin America & Caribbean Latin America & Caribbean (excluding high income)Latin America & the Caribbean (IDA & IBRD countries)LatviaLeast developed countries: UN classificationLebanonLiberiaLibyaLithuaniaLow & middle incomeLow incomeLower middle incomeLuxembourgMacao SAR, ChinaMacedonia, FYRMadagascarMalawiMalaysiaMaldivesMaliMaltaMauritaniaMauritiusMexicoMiddle East & North AfricaMiddle East & North Africa (excluding high income)Middle East & North Africa (IDA & IBRD countries)Middle incomeMoldovaMongoliaMontenegroMoroccoMozambiqueMyanmarNauruNepalNetherlandsNew CaledoniaNew ZealandNicaraguaNigerNigeriaNorth AmericaNorwayOECD membersOmanOther small statesPacific island small statesPakistanPanamaPapua New GuineaParaguayPeruPhilippinesPolandPortugalPost-demographic dividendPre-demographic dividendQatarRomaniaRussian FederationRwandaSamoaSaudi ArabiaSenegalSerbiaSeychellesSierra LeoneSingaporeSlovak RepublicSloveniaSmall statesSomaliaSouth AfricaSouth AsiaSouth Asia (IDA & IBRD)SpainSri LankaSt. LuciaSt. Vincent and the GrenadinesSub-Saharan Africa Sub-Saharan Africa (excluding high income)Sub-Saharan Africa (IDA & IBRD countries)SudanSurinameSwedenSwitzerlandSyrian Arab RepublicTajikistanTanzaniaThailandTogoTongaTrinidad and TobagoTunisiaTurkeyTurkmenistanUgandaUkraineUnited Arab EmiratesUnited KingdomUnited StatesUpper middle incomeUruguayVanuatuVenezuela, RBVietnamWorldYemen, Rep.ZambiaZimbabwe Timeline:
This timeline shows a graph from 1961 to 2015 of Guatemala. No data until 1960. Number of actual observations by date: 55.
Source name:
World Development Indicators
Source organization:
World Bank staff estimates based data from International Monetary Fund's Direction of Trade database.
Categories, topics:
Private Sector, Trade
Last updated:
apr 23, 2017
Indicators value changes by year
At the date of observation
Value
Absolute change
Change from previous value
jan 1, 1967
0.088
+0.088
%
jan 1, 1968
0.0
-0.088
-100.0%
jan 1, 1974
0.0
0.0
-100.0%
jan 1, 1977
0.095
+0.095
%
jan 1, 1978
1.455
+1.36
1.43K%
jan 1, 1979
0.076
-1.379
-94.78%
jan 1, 1980
0.013
-0.063
-82.81%
jan 1, 1981
0.014
+0.001
7.56%
jan 1, 1982
0.006
-0.008
-54.63%
jan 1, 1983
0.019
+0.013
204.4%
jan 1, 1984
0.049
+0.029
151.12%
jan 1, 1985
0.058
+0.01
20.03%
jan 1, 1986
0.277
+0.218
373.44%
jan 1, 1987
0.604
+0.328
118.41%
jan 1, 1988
0.328
-0.276
-45.66%
jan 1, 1989
0.678
+0.35
106.64%
jan 1, 1990
0.141
-0.538
-79.23%
jan 1, 1991
0.312
+0.172
121.74%
jan 1, 1992
1.246
+0.934
298.78%
jan 1, 1993
0.477
-0.769
-61.74%
jan 1, 1994
0.153
-0.324
-67.91%
jan 1, 1995
1.633
+1.48
967.52%
jan 1, 1996
0.694
-0.939
-57.52%
jan 1, 1997
0.075
-0.619
-89.19%
jan 1, 1998
1.025
+0.95
1.27K%
jan 1, 1999
0.067
-0.958
-93.43%
jan 1, 2000
0.042
-0.025
-37.51%
jan 1, 2001
0.031
-0.011
-25.44%
jan 1, 2002
0.066
+0.034
108.81%
jan 1, 2003
0.092
+0.027
41.05%
jan 1, 2004
0.173
+0.081
87.55%
jan 1, 2005
0.201
+0.027
15.64%
jan 1, 2006
0.195
-0.005
-2.69%
jan 1, 2007
0.177
-0.018
-9.32%
jan 1, 2008
0.291
+0.114
64.43%
jan 1, 2009
0.32
+0.029
9.86%
jan 1, 2010
0.808
+0.488
152.72%
jan 1, 2011
1.026
+0.218
26.98%
jan 1, 2012
0.42
-0.606
-59.04%
jan 1, 2013
0.653
+0.233
55.52%
jan 1, 2014
0.372
-0.282
-43.13%
jan 1, 2015
0.369
-0.003
-0.71%
Ranking of countries by current statistics by years


Comments: