29
/
en
AIzaSyAYiBZKx7MnpbEhh9jyipgxe19OcubqV5w
April 1, 2024
40487
Late-demographic dividend
LTE
false
2
1
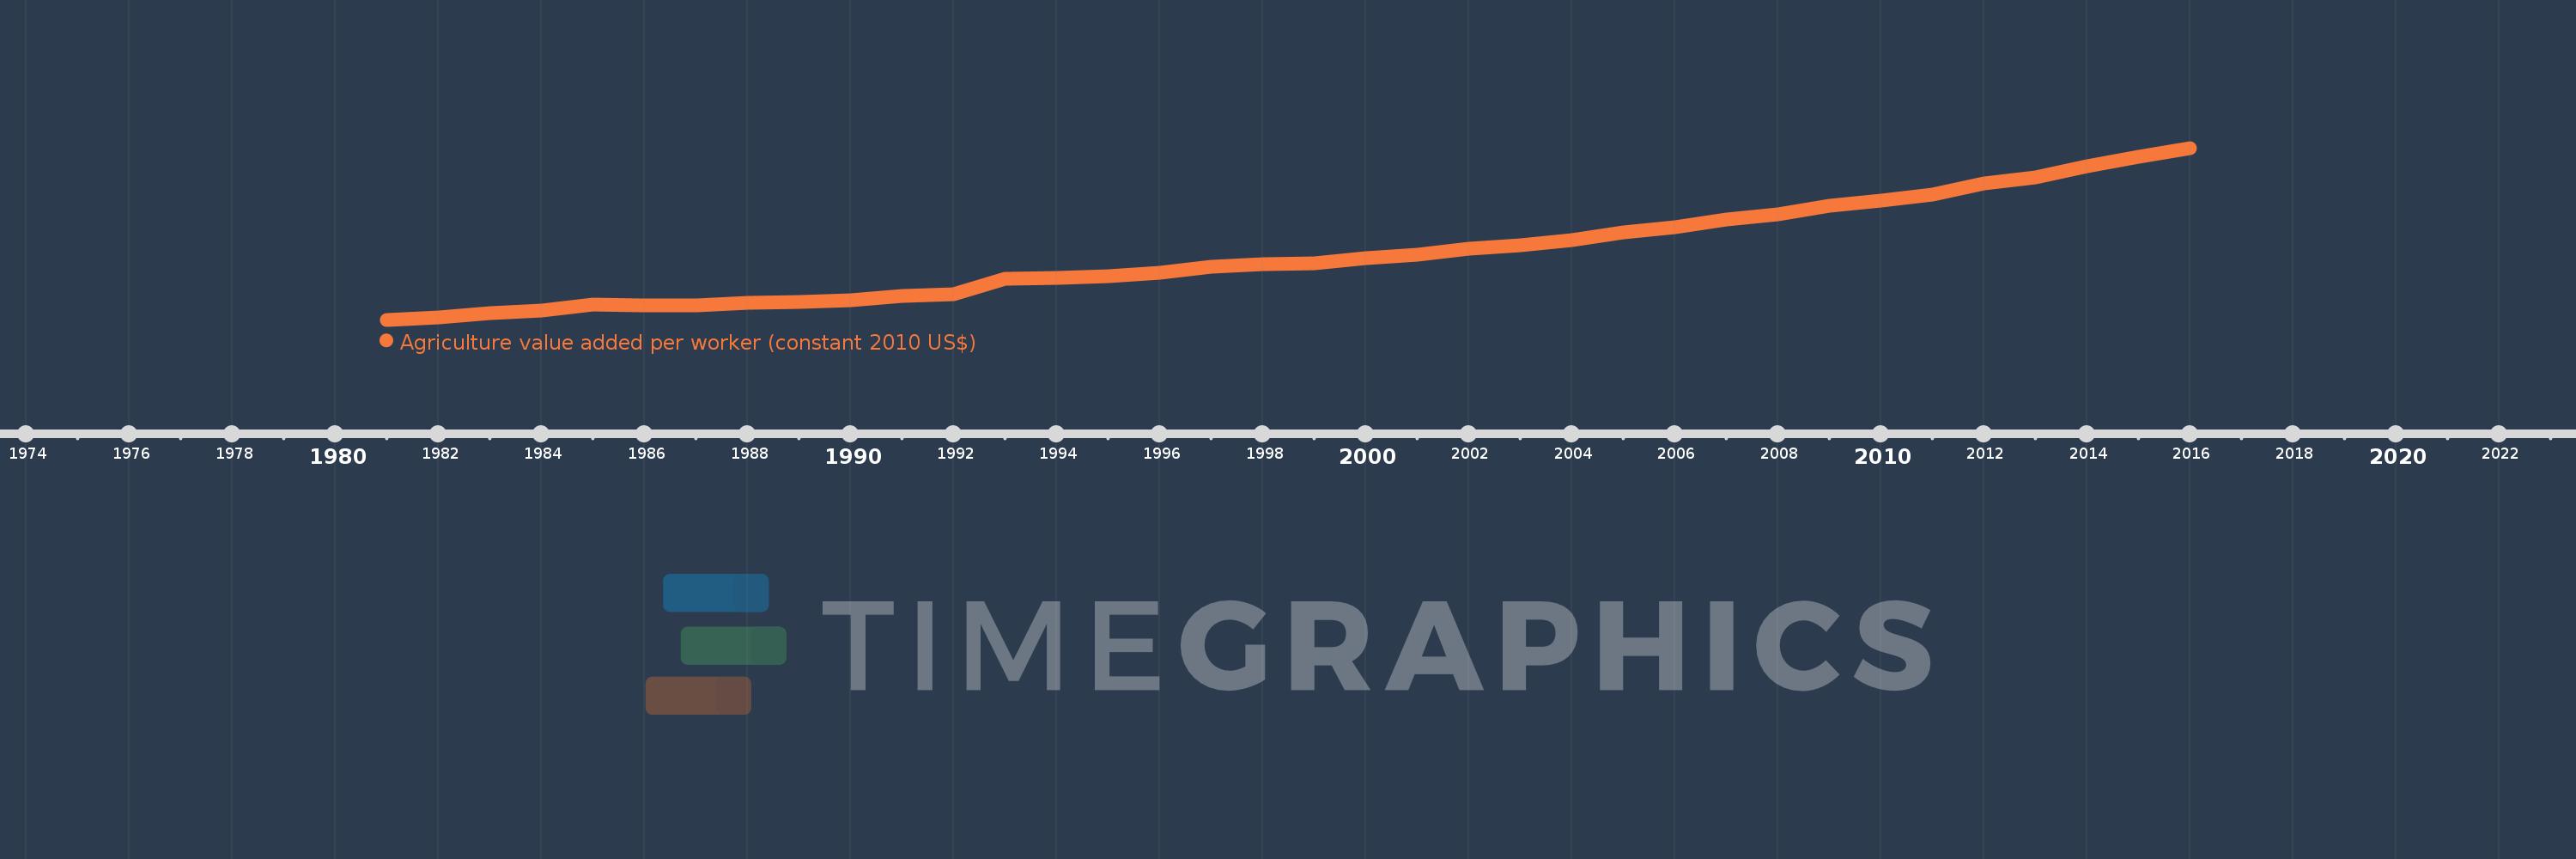
Agriculture value added per worker (constant 2010 US$)
2016,2015,2014,2013,2012,2011,2010,2009,2008,2007,2006,2005,2004,2003,2002,2001,2000,1999,1998,1997,1996,1995,1994,1993,1992,1991,1990,1989,1988,1987,1986,1985,1984,1983,1982,1981
This statistics in other country:
AfghanistanAlbaniaAlgeriaAndorraAntigua and BarbudaArab WorldArgentinaArmeniaArubaAustraliaAustriaAzerbaijanBahamas, TheBahrainBangladeshBarbadosBelarusBelgiumBelizeBeninBermudaBhutanBoliviaBosnia and HerzegovinaBotswanaBrazilBrunei DarussalamBulgariaBurkina FasoBurundiCabo VerdeCambodiaCameroonCanadaCaribbean small statesCentral African RepublicCentral Europe and the BalticsChadChileChinaColombiaComorosCongo, Dem. Rep.Congo, Rep.Costa RicaCote d'IvoireCroatiaCubaCyprusCzech RepublicDenmarkDominicaDominican RepublicEarly-demographic dividendEast Asia & PacificEast Asia & Pacific (excluding high income)East Asia & Pacific (IDA & IBRD countries)EcuadorEgypt, Arab Rep.El SalvadorEquatorial GuineaEstoniaEthiopiaEuro areaEurope & Central AsiaEurope & Central Asia (excluding high income)Europe & Central Asia (IDA & IBRD countries)European UnionFijiFinlandFragile and conflict affected situationsFranceGabonGambia, TheGeorgiaGermanyGhanaGreeceGrenadaGuatemalaGuineaGuinea-BissauGuyanaHeavily indebted poor countries (HIPC)High incomeHondurasHungaryIBRD onlyIcelandIDA & IBRD totalIDA blendIDA onlyIDA totalIndiaIndonesiaIran, Islamic Rep.IraqIrelandItalyJamaicaJapanJordanKazakhstanKenyaKiribatiKorea, Rep.KuwaitKyrgyz RepublicLao PDRLate-demographic dividendLatin America & Caribbean Latin America & Caribbean (excluding high income)Latin America & the Caribbean (IDA & IBRD countries)LatviaLeast developed countries: UN classificationLebanonLesothoLiberiaLithuaniaLow & middle incomeLow incomeLower middle incomeLuxembourgMacedonia, FYRMadagascarMalawiMalaysiaMaldivesMaliMaltaMarshall IslandsMauritaniaMauritiusMexicoMicronesia, Fed. Sts.Middle East & North AfricaMiddle East & North Africa (excluding high income)Middle East & North Africa (IDA & IBRD countries)Middle incomeMoldovaMongoliaMontenegroMoroccoMozambiqueMyanmarNamibiaNepalNetherlandsNew ZealandNicaraguaNigerNigeriaNorth AmericaNorwayOECD membersOmanOther small statesPakistanPalauPanamaParaguayPeruPhilippinesPolandPortugalPost-demographic dividendPre-demographic dividendPuerto RicoQatarRomaniaRussian FederationRwandaSamoaSao Tome and PrincipeSaudi ArabiaSenegalSerbiaSeychellesSierra LeoneSingaporeSlovak RepublicSloveniaSmall statesSouth AfricaSouth AsiaSouth Asia (IDA & IBRD)SpainSri LankaSt. Kitts and NevisSt. LuciaSt. Vincent and the GrenadinesSub-Saharan Africa Sub-Saharan Africa (excluding high income)Sub-Saharan Africa (IDA & IBRD countries)SudanSurinameSwazilandSwedenSwitzerlandTajikistanTanzaniaThailandTimor-LesteTogoTongaTrinidad and TobagoTunisiaTurkeyTurkmenistanTuvaluUgandaUkraineUnited Arab EmiratesUnited KingdomUnited StatesUpper middle incomeUruguayUzbekistanVanuatuVenezuela, RBVietnamWest Bank and GazaWorldYemen, Rep.ZambiaZimbabwe Timeline:
This timeline shows a graph from 1981 to 2016 of Late-demographic dividend. No data until 1980. Number of actual observations by date: 36.
Source name:
World Development Indicators
Source organization:
Derived from World Bank national accounts files and Food and Agriculture Organization, Production Yearbook and data files.
Categories, topics:
Agriculture & Rural Development
Last updated:
apr 23, 2017
Indicators value changes by year
Minimum:
562.529
jan 1, 1981
Maximum:
1.915K
jan 1, 2016
At the date of observation
Value
Absolute change
Change from previous value
jan 1, 1981
562.529
+562.529
0.0%
jan 1, 1982
583.675
+21.146
3.76%
jan 1, 1983
615.538
+31.863
5.46%
jan 1, 1984
636.88
+21.342
3.47%
jan 1, 1985
681.191
+44.311
6.96%
jan 1, 1986
677.208
-3.983
-0.58%
jan 1, 1987
676.254
-0.954
-0.14%
jan 1, 1988
694.918
+18.664
2.76%
jan 1, 1989
702.243
+7.325
1.05%
jan 1, 1990
716.042
+13.798
1.96%
jan 1, 1991
752.891
+36.849
5.15%
jan 1, 1992
760.379
+7.488
0.99%
jan 1, 1993
885.234
+124.855
16.42%
jan 1, 1994
894.32
+9.087
1.03%
jan 1, 1995
906.366
+12.046
1.35%
jan 1, 1996
932.936
+26.57
2.93%
jan 1, 1997
976.537
+43.601
4.67%
jan 1, 1998
997.97
+21.433
2.19%
jan 1, 1999
1.008K
+10.445
1.05%
jan 1, 2000
1.044K
+35.805
3.55%
jan 1, 2001
1.072K
+27.726
2.66%
jan 1, 2002
1.119K
+47.25
4.41%
jan 1, 2003
1.152K
+32.979
2.95%
jan 1, 2004
1.193K
+40.486
3.51%
jan 1, 2005
1.252K
+59.365
4.98%
jan 1, 2006
1.29K
+37.573
3.0%
jan 1, 2007
1.353K
+62.968
4.88%
jan 1, 2008
1.39K
+37.631
2.78%
jan 1, 2009
1.46K
+69.869
5.03%
jan 1, 2010
1.499K
+38.652
2.65%
jan 1, 2011
1.547K
+48.11
3.21%
jan 1, 2012
1.638K
+91.016
5.88%
jan 1, 2013
1.68K
+42.454
2.59%
jan 1, 2014
1.771K
+90.974
5.41%
jan 1, 2015
1.843K
+71.362
4.03%
jan 1, 2016
1.915K
+72.601
3.94%
Ranking of countries by current statistics by years


Comments: