29
/
en
AIzaSyAYiBZKx7MnpbEhh9jyipgxe19OcubqV5w
April 1, 2024
230656
Rwanda
RWA
true
2
1
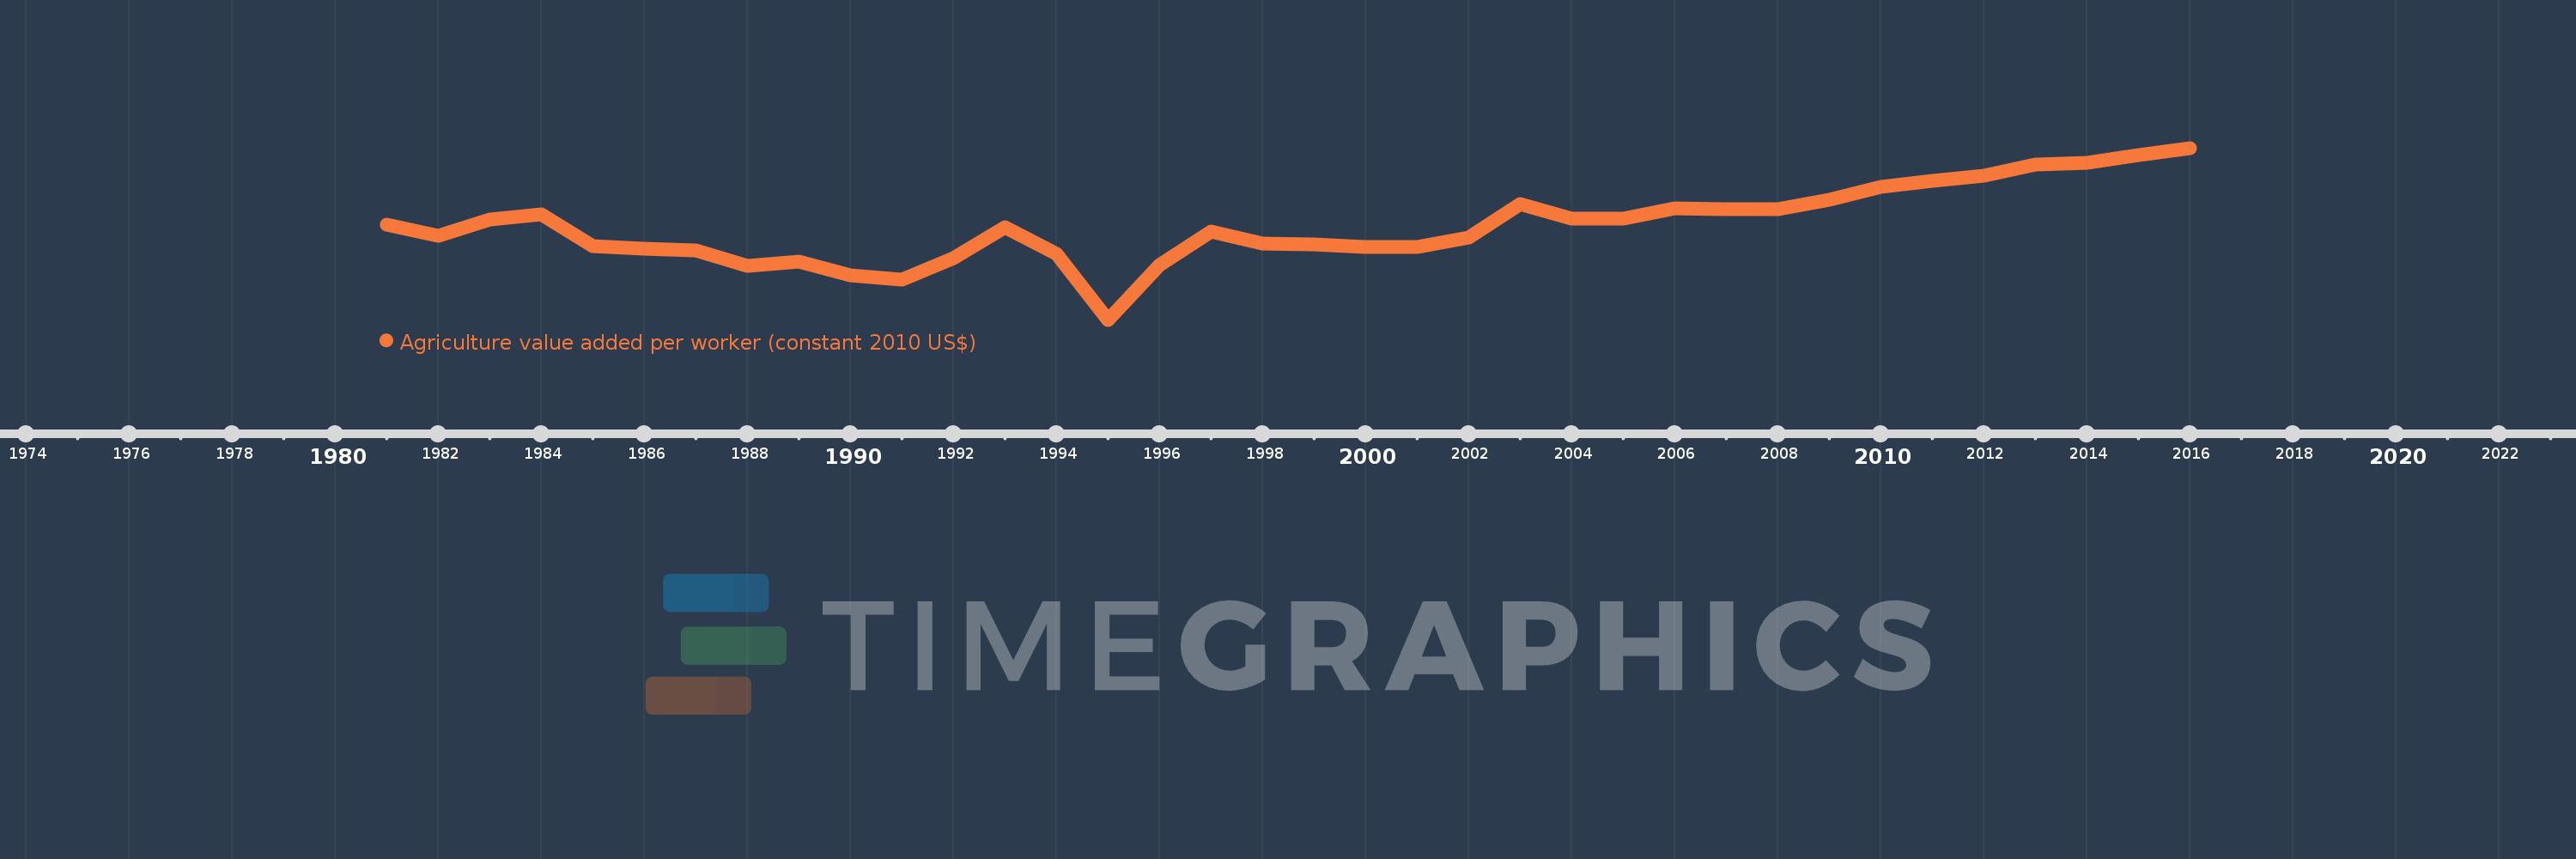
Agriculture value added per worker (constant 2010 US$)
2016,2015,2014,2013,2012,2011,2010,2009,2008,2007,2006,2005,2004,2003,2002,2001,2000,1999,1998,1997,1996,1995,1994,1993,1992,1991,1990,1989,1988,1987,1986,1985,1984,1983,1982,1981
This statistics in other country:
AfghanistanAlbaniaAlgeriaAndorraAntigua and BarbudaArab WorldArgentinaArmeniaArubaAustraliaAustriaAzerbaijanBahamas, TheBahrainBangladeshBarbadosBelarusBelgiumBelizeBeninBermudaBhutanBoliviaBosnia and HerzegovinaBotswanaBrazilBrunei DarussalamBulgariaBurkina FasoBurundiCabo VerdeCambodiaCameroonCanadaCaribbean small statesCentral African RepublicCentral Europe and the BalticsChadChileChinaColombiaComorosCongo, Dem. Rep.Congo, Rep.Costa RicaCote d'IvoireCroatiaCubaCyprusCzech RepublicDenmarkDominicaDominican RepublicEarly-demographic dividendEast Asia & PacificEast Asia & Pacific (excluding high income)East Asia & Pacific (IDA & IBRD countries)EcuadorEgypt, Arab Rep.El SalvadorEquatorial GuineaEstoniaEthiopiaEuro areaEurope & Central AsiaEurope & Central Asia (excluding high income)Europe & Central Asia (IDA & IBRD countries)European UnionFijiFinlandFragile and conflict affected situationsFranceGabonGambia, TheGeorgiaGermanyGhanaGreeceGrenadaGuatemalaGuineaGuinea-BissauGuyanaHeavily indebted poor countries (HIPC)High incomeHondurasHungaryIBRD onlyIcelandIDA & IBRD totalIDA blendIDA onlyIDA totalIndiaIndonesiaIran, Islamic Rep.IraqIrelandItalyJamaicaJapanJordanKazakhstanKenyaKiribatiKorea, Rep.KuwaitKyrgyz RepublicLao PDRLate-demographic dividendLatin America & Caribbean Latin America & Caribbean (excluding high income)Latin America & the Caribbean (IDA & IBRD countries)LatviaLeast developed countries: UN classificationLebanonLesothoLiberiaLithuaniaLow & middle incomeLow incomeLower middle incomeLuxembourgMacedonia, FYRMadagascarMalawiMalaysiaMaldivesMaliMaltaMarshall IslandsMauritaniaMauritiusMexicoMicronesia, Fed. Sts.Middle East & North AfricaMiddle East & North Africa (excluding high income)Middle East & North Africa (IDA & IBRD countries)Middle incomeMoldovaMongoliaMontenegroMoroccoMozambiqueMyanmarNamibiaNepalNetherlandsNew ZealandNicaraguaNigerNigeriaNorth AmericaNorwayOECD membersOmanOther small statesPakistanPalauPanamaParaguayPeruPhilippinesPolandPortugalPost-demographic dividendPre-demographic dividendPuerto RicoQatarRomaniaRussian FederationRwandaSamoaSao Tome and PrincipeSaudi ArabiaSenegalSerbiaSeychellesSierra LeoneSingaporeSlovak RepublicSloveniaSmall statesSouth AfricaSouth AsiaSouth Asia (IDA & IBRD)SpainSri LankaSt. Kitts and NevisSt. LuciaSt. Vincent and the GrenadinesSub-Saharan Africa Sub-Saharan Africa (excluding high income)Sub-Saharan Africa (IDA & IBRD countries)SudanSurinameSwazilandSwedenSwitzerlandTajikistanTanzaniaThailandTimor-LesteTogoTongaTrinidad and TobagoTunisiaTurkeyTurkmenistanTuvaluUgandaUkraineUnited Arab EmiratesUnited KingdomUnited StatesUpper middle incomeUruguayUzbekistanVanuatuVenezuela, RBVietnamWest Bank and GazaWorldYemen, Rep.ZambiaZimbabwe Timeline:
This timeline shows a graph from 1981 to 2016 of Rwanda. No data until 1980. Number of actual observations by date: 36.
Source name:
World Development Indicators
Source organization:
Derived from World Bank national accounts files and Food and Agriculture Organization, Production Yearbook and data files.
Categories, topics:
Agriculture & Rural Development
Last updated:
apr 23, 2017
Indicators value changes by year
Minimum:
236.349
jan 1, 1995
Maximum:
470.709
jan 1, 2016
At the date of observation
Value
Absolute change
Change from previous value
jan 1, 1981
365.723
+365.723
0.0%
jan 1, 1982
350.849
-14.874
-4.07%
jan 1, 1983
373.221
+22.372
6.38%
jan 1, 1984
379.861
+6.64
1.78%
jan 1, 1985
336.308
-43.554
-11.47%
jan 1, 1986
333.494
-2.813
-0.84%
jan 1, 1987
330.407
-3.088
-0.93%
jan 1, 1988
310.153
-20.254
-6.13%
jan 1, 1989
315.983
+5.831
1.88%
jan 1, 1990
297.082
-18.902
-5.98%
jan 1, 1991
291.527
-5.554
-1.87%
jan 1, 1992
320.937
+29.41
10.09%
jan 1, 1993
362.18
+41.243
12.85%
jan 1, 1994
326.016
-36.164
-9.99%
jan 1, 1995
236.349
-89.668
-27.5%
jan 1, 1996
310.663
+74.315
31.44%
jan 1, 1997
356.491
+45.828
14.75%
jan 1, 1998
340.543
-15.948
-4.47%
jan 1, 1999
339.193
-1.35
-0.4%
jan 1, 2000
335.668
-3.525
-1.04%
jan 1, 2001
336.114
+0.446
0.13%
jan 1, 2002
348.483
+12.369
3.68%
jan 1, 2003
394.295
+45.812
13.15%
jan 1, 2004
374.106
-20.19
-5.12%
jan 1, 2005
373.913
-0.192
-0.05%
jan 1, 2006
387.98
+14.067
3.76%
jan 1, 2007
387.147
-0.833
-0.21%
jan 1, 2008
386.939
-0.208
-0.05%
jan 1, 2009
399.787
+12.848
3.32%
jan 1, 2010
417.778
+17.991
4.5%
jan 1, 2011
425.574
+7.796
1.87%
jan 1, 2012
432.925
+7.351
1.73%
jan 1, 2013
447.795
+14.87
3.43%
jan 1, 2014
449.913
+2.119
0.47%
jan 1, 2015
460.691
+10.778
2.4%
jan 1, 2016
470.709
+10.018
2.17%
Ranking of countries by current statistics by years


Comments: