29
/
en
AIzaSyAYiBZKx7MnpbEhh9jyipgxe19OcubqV5w
April 1, 2024
260496
Tanzania
TZA
true
2
1
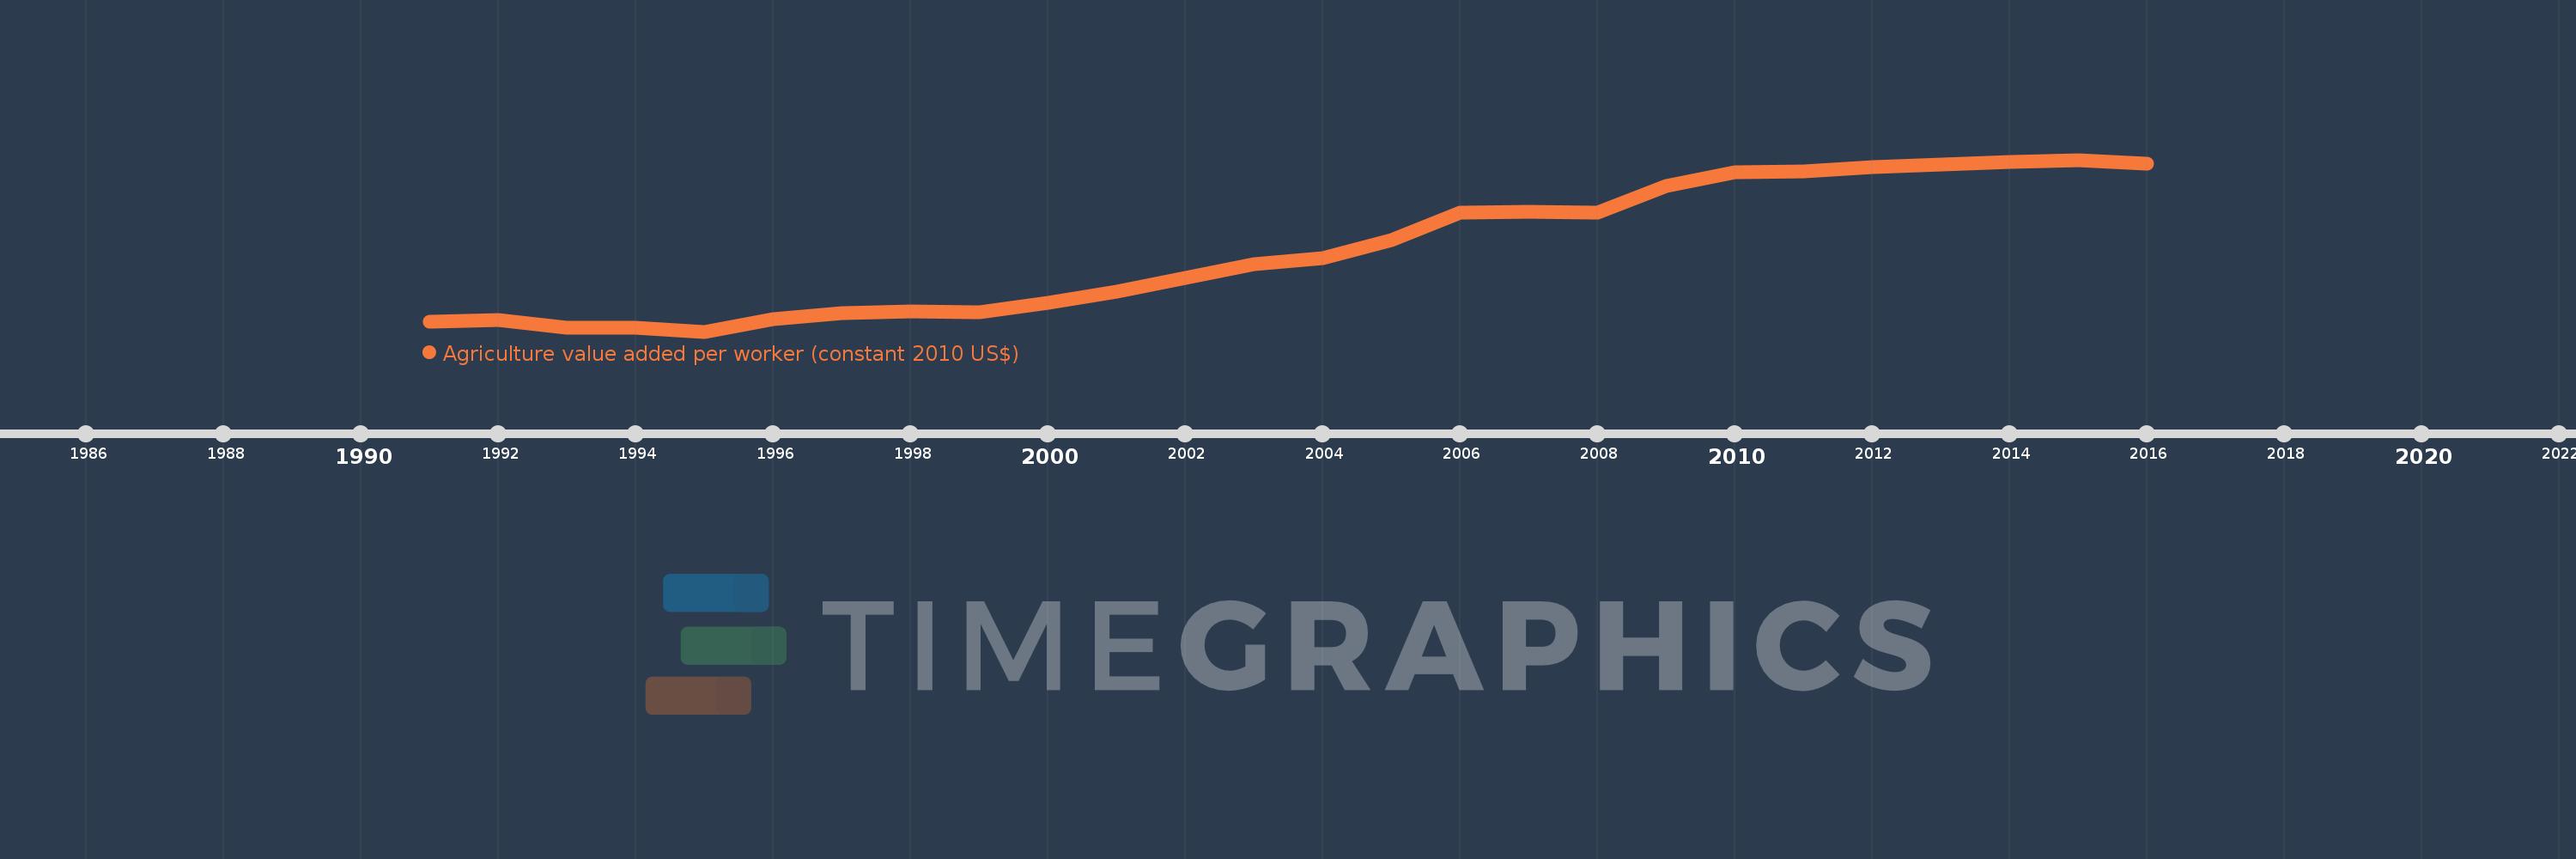
Agriculture value added per worker (constant 2010 US$)
2016,2015,2014,2013,2012,2011,2010,2009,2008,2007,2006,2005,2004,2003,2002,2001,2000,1999,1998,1997,1996,1995,1994,1993,1992,1991
This statistics in other country:
AfghanistanAlbaniaAlgeriaAndorraAntigua and BarbudaArab WorldArgentinaArmeniaArubaAustraliaAustriaAzerbaijanBahamas, TheBahrainBangladeshBarbadosBelarusBelgiumBelizeBeninBermudaBhutanBoliviaBosnia and HerzegovinaBotswanaBrazilBrunei DarussalamBulgariaBurkina FasoBurundiCabo VerdeCambodiaCameroonCanadaCaribbean small statesCentral African RepublicCentral Europe and the BalticsChadChileChinaColombiaComorosCongo, Dem. Rep.Congo, Rep.Costa RicaCote d'IvoireCroatiaCubaCyprusCzech RepublicDenmarkDominicaDominican RepublicEarly-demographic dividendEast Asia & PacificEast Asia & Pacific (excluding high income)East Asia & Pacific (IDA & IBRD countries)EcuadorEgypt, Arab Rep.El SalvadorEquatorial GuineaEstoniaEthiopiaEuro areaEurope & Central AsiaEurope & Central Asia (excluding high income)Europe & Central Asia (IDA & IBRD countries)European UnionFijiFinlandFragile and conflict affected situationsFranceGabonGambia, TheGeorgiaGermanyGhanaGreeceGrenadaGuatemalaGuineaGuinea-BissauGuyanaHeavily indebted poor countries (HIPC)High incomeHondurasHungaryIBRD onlyIcelandIDA & IBRD totalIDA blendIDA onlyIDA totalIndiaIndonesiaIran, Islamic Rep.IraqIrelandItalyJamaicaJapanJordanKazakhstanKenyaKiribatiKorea, Rep.KuwaitKyrgyz RepublicLao PDRLate-demographic dividendLatin America & Caribbean Latin America & Caribbean (excluding high income)Latin America & the Caribbean (IDA & IBRD countries)LatviaLeast developed countries: UN classificationLebanonLesothoLiberiaLithuaniaLow & middle incomeLow incomeLower middle incomeLuxembourgMacedonia, FYRMadagascarMalawiMalaysiaMaldivesMaliMaltaMarshall IslandsMauritaniaMauritiusMexicoMicronesia, Fed. Sts.Middle East & North AfricaMiddle East & North Africa (excluding high income)Middle East & North Africa (IDA & IBRD countries)Middle incomeMoldovaMongoliaMontenegroMoroccoMozambiqueMyanmarNamibiaNepalNetherlandsNew ZealandNicaraguaNigerNigeriaNorth AmericaNorwayOECD membersOmanOther small statesPakistanPalauPanamaParaguayPeruPhilippinesPolandPortugalPost-demographic dividendPre-demographic dividendPuerto RicoQatarRomaniaRussian FederationRwandaSamoaSao Tome and PrincipeSaudi ArabiaSenegalSerbiaSeychellesSierra LeoneSingaporeSlovak RepublicSloveniaSmall statesSouth AfricaSouth AsiaSouth Asia (IDA & IBRD)SpainSri LankaSt. Kitts and NevisSt. LuciaSt. Vincent and the GrenadinesSub-Saharan Africa Sub-Saharan Africa (excluding high income)Sub-Saharan Africa (IDA & IBRD countries)SudanSurinameSwazilandSwedenSwitzerlandTajikistanTanzaniaThailandTimor-LesteTogoTongaTrinidad and TobagoTunisiaTurkeyTurkmenistanTuvaluUgandaUkraineUnited Arab EmiratesUnited KingdomUnited StatesUpper middle incomeUruguayUzbekistanVanuatuVenezuela, RBVietnamWest Bank and GazaWorldYemen, Rep.ZambiaZimbabwe Timeline:
This timeline shows a graph from 1991 to 2016 of Tanzania. No data until 1990. Number of actual observations by date: 26.
Source name:
World Development Indicators
Source organization:
Derived from World Bank national accounts files and Food and Agriculture Organization, Production Yearbook and data files.
Categories, topics:
Agriculture & Rural Development
Last updated:
apr 23, 2017
Indicators value changes by year
Minimum:
399.847
jan 1, 1995
Maximum:
568.109
jan 1, 2015
At the date of observation
Value
Absolute change
Change from previous value
jan 1, 1991
409.632
+409.632
0.0%
jan 1, 1992
411.204
+1.571
0.38%
jan 1, 1993
403.397
-7.807
-1.9%
jan 1, 1994
403.223
-0.174
-0.04%
jan 1, 1995
399.847
-3.376
-0.84%
jan 1, 1996
412.162
+12.315
3.08%
jan 1, 1997
418.146
+5.984
1.45%
jan 1, 1998
419.362
+1.215
0.29%
jan 1, 1999
419.085
-0.277
-0.07%
jan 1, 2000
428.065
+8.98
2.14%
jan 1, 2001
439.14
+11.075
2.59%
jan 1, 2002
452.729
+13.589
3.09%
jan 1, 2003
466.199
+13.469
2.98%
jan 1, 2004
471.653
+5.454
1.17%
jan 1, 2005
489.392
+17.74
3.76%
jan 1, 2006
516.17
+26.778
5.47%
jan 1, 2007
516.805
+0.635
0.12%
jan 1, 2008
516.499
-0.307
-0.06%
jan 1, 2009
542.167
+25.668
4.97%
jan 1, 2010
555.929
+13.762
2.54%
jan 1, 2011
556.504
+0.575
0.1%
jan 1, 2012
560.878
+4.375
0.79%
jan 1, 2013
563.617
+2.739
0.49%
jan 1, 2014
565.639
+2.021
0.36%
jan 1, 2015
568.109
+2.47
0.44%
jan 1, 2016
564.262
-3.847
-0.68%
Ranking of countries by current statistics by years


Comments: