29
/
en
AIzaSyAYiBZKx7MnpbEhh9jyipgxe19OcubqV5w
April 1, 2024
102125
Central African Republic
CAF
true
2
1
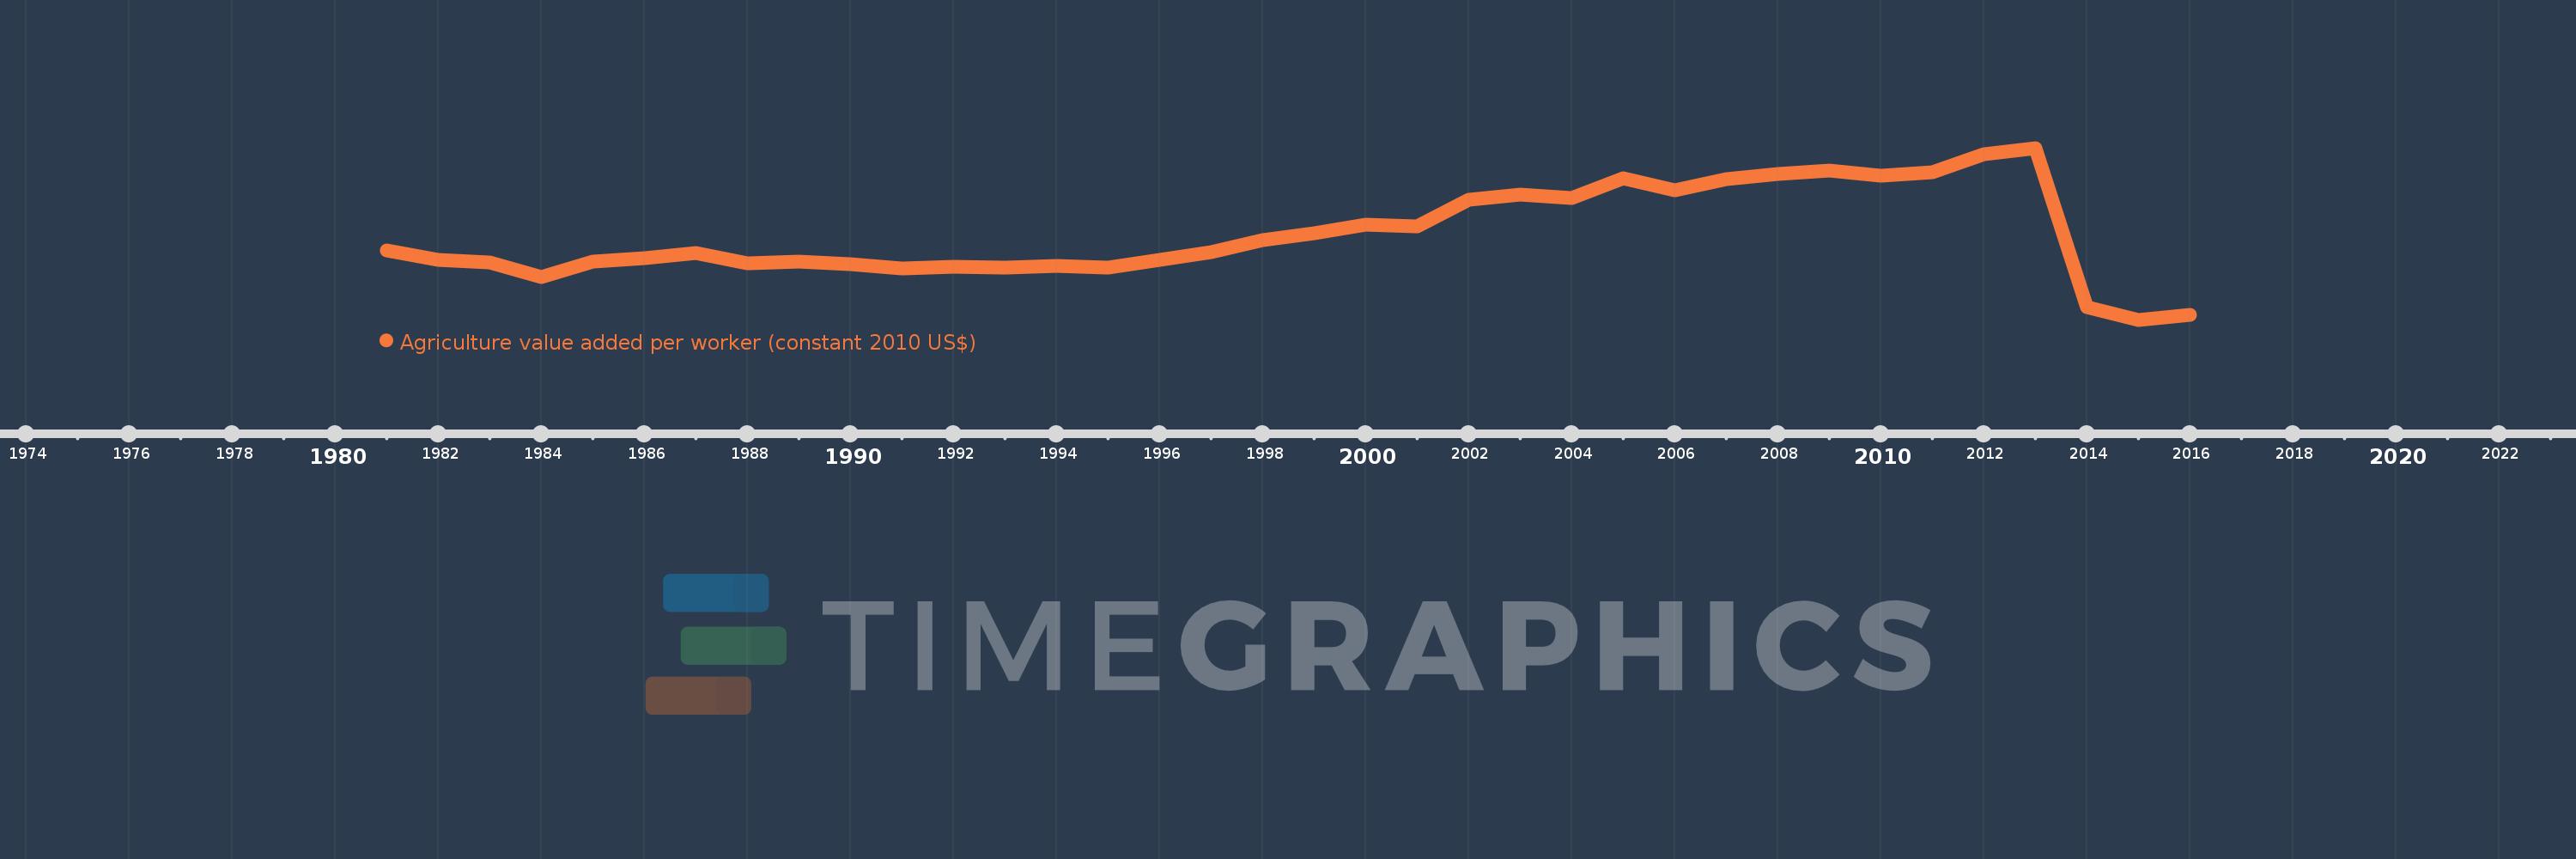
Agriculture value added per worker (constant 2010 US$)
2016,2015,2014,2013,2012,2011,2010,2009,2008,2007,2006,2005,2004,2003,2002,2001,2000,1999,1998,1997,1996,1995,1994,1993,1992,1991,1990,1989,1988,1987,1986,1985,1984,1983,1982,1981
This statistics in other country:
AfghanistanAlbaniaAlgeriaAndorraAntigua and BarbudaArab WorldArgentinaArmeniaArubaAustraliaAustriaAzerbaijanBahamas, TheBahrainBangladeshBarbadosBelarusBelgiumBelizeBeninBermudaBhutanBoliviaBosnia and HerzegovinaBotswanaBrazilBrunei DarussalamBulgariaBurkina FasoBurundiCabo VerdeCambodiaCameroonCanadaCaribbean small statesCentral African RepublicCentral Europe and the BalticsChadChileChinaColombiaComorosCongo, Dem. Rep.Congo, Rep.Costa RicaCote d'IvoireCroatiaCubaCyprusCzech RepublicDenmarkDominicaDominican RepublicEarly-demographic dividendEast Asia & PacificEast Asia & Pacific (excluding high income)East Asia & Pacific (IDA & IBRD countries)EcuadorEgypt, Arab Rep.El SalvadorEquatorial GuineaEstoniaEthiopiaEuro areaEurope & Central AsiaEurope & Central Asia (excluding high income)Europe & Central Asia (IDA & IBRD countries)European UnionFijiFinlandFragile and conflict affected situationsFranceGabonGambia, TheGeorgiaGermanyGhanaGreeceGrenadaGuatemalaGuineaGuinea-BissauGuyanaHeavily indebted poor countries (HIPC)High incomeHondurasHungaryIBRD onlyIcelandIDA & IBRD totalIDA blendIDA onlyIDA totalIndiaIndonesiaIran, Islamic Rep.IraqIrelandItalyJamaicaJapanJordanKazakhstanKenyaKiribatiKorea, Rep.KuwaitKyrgyz RepublicLao PDRLate-demographic dividendLatin America & Caribbean Latin America & Caribbean (excluding high income)Latin America & the Caribbean (IDA & IBRD countries)LatviaLeast developed countries: UN classificationLebanonLesothoLiberiaLithuaniaLow & middle incomeLow incomeLower middle incomeLuxembourgMacedonia, FYRMadagascarMalawiMalaysiaMaldivesMaliMaltaMarshall IslandsMauritaniaMauritiusMexicoMicronesia, Fed. Sts.Middle East & North AfricaMiddle East & North Africa (excluding high income)Middle East & North Africa (IDA & IBRD countries)Middle incomeMoldovaMongoliaMontenegroMoroccoMozambiqueMyanmarNamibiaNepalNetherlandsNew ZealandNicaraguaNigerNigeriaNorth AmericaNorwayOECD membersOmanOther small statesPakistanPalauPanamaParaguayPeruPhilippinesPolandPortugalPost-demographic dividendPre-demographic dividendPuerto RicoQatarRomaniaRussian FederationRwandaSamoaSao Tome and PrincipeSaudi ArabiaSenegalSerbiaSeychellesSierra LeoneSingaporeSlovak RepublicSloveniaSmall statesSouth AfricaSouth AsiaSouth Asia (IDA & IBRD)SpainSri LankaSt. Kitts and NevisSt. LuciaSt. Vincent and the GrenadinesSub-Saharan Africa Sub-Saharan Africa (excluding high income)Sub-Saharan Africa (IDA & IBRD countries)SudanSurinameSwazilandSwedenSwitzerlandTajikistanTanzaniaThailandTimor-LesteTogoTongaTrinidad and TobagoTunisiaTurkeyTurkmenistanTuvaluUgandaUkraineUnited Arab EmiratesUnited KingdomUnited StatesUpper middle incomeUruguayUzbekistanVanuatuVenezuela, RBVietnamWest Bank and GazaWorldYemen, Rep.ZambiaZimbabwe Timeline:
This timeline shows a graph from 1981 to 2016 of Central African Republic. No data until 1980. Number of actual observations by date: 36.
Source name:
World Development Indicators
Source organization:
Derived from World Bank national accounts files and Food and Agriculture Organization, Production Yearbook and data files.
Categories, topics:
Agriculture & Rural Development
Last updated:
apr 23, 2017
Indicators value changes by year
Minimum:
431.948
jan 1, 2015
Maximum:
856.199
jan 1, 2013
At the date of observation
Value
Absolute change
Change from previous value
jan 1, 1981
603.714
+603.714
0.0%
jan 1, 1982
580.615
-23.098
-3.83%
jan 1, 1983
574.438
-6.177
-1.06%
jan 1, 1984
538.02
-36.418
-6.34%
jan 1, 1985
574.694
+36.674
6.82%
jan 1, 1986
583.455
+8.761
1.52%
jan 1, 1987
596.887
+13.432
2.3%
jan 1, 1988
570.376
-26.511
-4.44%
jan 1, 1989
574.847
+4.471
0.78%
jan 1, 1990
568.876
-5.971
-1.04%
jan 1, 1991
558.568
-10.308
-1.81%
jan 1, 1992
563.2
+4.632
0.83%
jan 1, 1993
559.834
-3.365
-0.6%
jan 1, 1994
564.292
+4.457
0.8%
jan 1, 1995
560.456
-3.836
-0.68%
jan 1, 1996
580.153
+19.698
3.51%
jan 1, 1997
599.441
+19.288
3.32%
jan 1, 1998
629.538
+30.097
5.02%
jan 1, 1999
646.199
+16.661
2.65%
jan 1, 2000
666.353
+20.154
3.12%
jan 1, 2001
663.357
-2.996
-0.45%
jan 1, 2002
728.373
+65.016
9.8%
jan 1, 2003
741.756
+13.383
1.84%
jan 1, 2004
732.77
-8.987
-1.21%
jan 1, 2005
780.757
+47.987
6.55%
jan 1, 2006
751.243
-29.514
-3.78%
jan 1, 2007
780.044
+28.801
3.83%
jan 1, 2008
792.783
+12.738
1.63%
jan 1, 2009
800.905
+8.123
1.02%
jan 1, 2010
786.797
-14.108
-1.76%
jan 1, 2011
796.447
+9.65
1.23%
jan 1, 2012
840.638
+44.191
5.55%
jan 1, 2013
856.199
+15.561
1.85%
jan 1, 2014
463.894
-392.304
-45.82%
jan 1, 2015
431.948
-31.946
-6.89%
jan 1, 2016
443.557
+11.609
2.69%
Ranking of countries by current statistics by years


Comments: