29
/
en
AIzaSyAYiBZKx7MnpbEhh9jyipgxe19OcubqV5w
April 1, 2024
285502
Zambia
ZMB
true
2
1
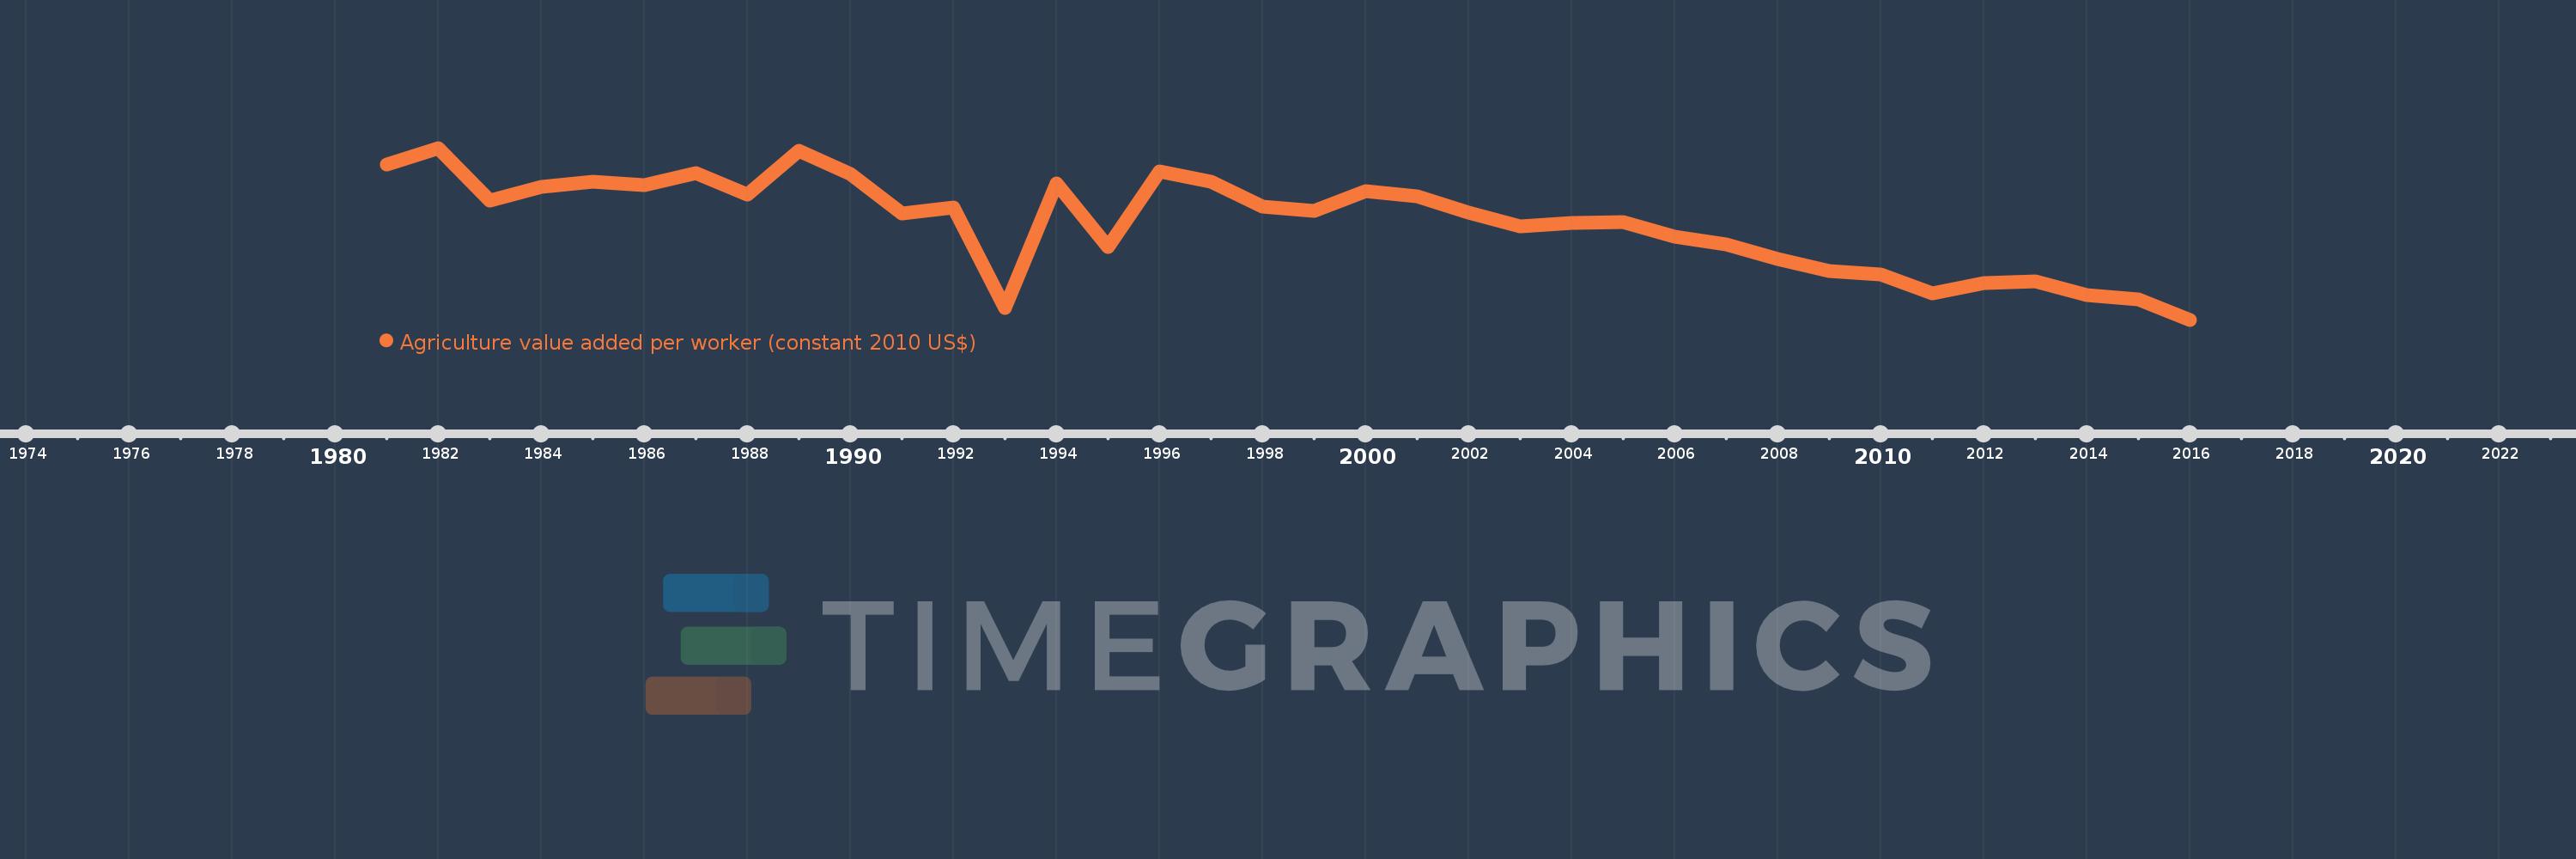
Agriculture value added per worker (constant 2010 US$)
2016,2015,2014,2013,2012,2011,2010,2009,2008,2007,2006,2005,2004,2003,2002,2001,2000,1999,1998,1997,1996,1995,1994,1993,1992,1991,1990,1989,1988,1987,1986,1985,1984,1983,1982,1981
This statistics in other country:
AfghanistanAlbaniaAlgeriaAndorraAntigua and BarbudaArab WorldArgentinaArmeniaArubaAustraliaAustriaAzerbaijanBahamas, TheBahrainBangladeshBarbadosBelarusBelgiumBelizeBeninBermudaBhutanBoliviaBosnia and HerzegovinaBotswanaBrazilBrunei DarussalamBulgariaBurkina FasoBurundiCabo VerdeCambodiaCameroonCanadaCaribbean small statesCentral African RepublicCentral Europe and the BalticsChadChileChinaColombiaComorosCongo, Dem. Rep.Congo, Rep.Costa RicaCote d'IvoireCroatiaCubaCyprusCzech RepublicDenmarkDominicaDominican RepublicEarly-demographic dividendEast Asia & PacificEast Asia & Pacific (excluding high income)East Asia & Pacific (IDA & IBRD countries)EcuadorEgypt, Arab Rep.El SalvadorEquatorial GuineaEstoniaEthiopiaEuro areaEurope & Central AsiaEurope & Central Asia (excluding high income)Europe & Central Asia (IDA & IBRD countries)European UnionFijiFinlandFragile and conflict affected situationsFranceGabonGambia, TheGeorgiaGermanyGhanaGreeceGrenadaGuatemalaGuineaGuinea-BissauGuyanaHeavily indebted poor countries (HIPC)High incomeHondurasHungaryIBRD onlyIcelandIDA & IBRD totalIDA blendIDA onlyIDA totalIndiaIndonesiaIran, Islamic Rep.IraqIrelandItalyJamaicaJapanJordanKazakhstanKenyaKiribatiKorea, Rep.KuwaitKyrgyz RepublicLao PDRLate-demographic dividendLatin America & Caribbean Latin America & Caribbean (excluding high income)Latin America & the Caribbean (IDA & IBRD countries)LatviaLeast developed countries: UN classificationLebanonLesothoLiberiaLithuaniaLow & middle incomeLow incomeLower middle incomeLuxembourgMacedonia, FYRMadagascarMalawiMalaysiaMaldivesMaliMaltaMarshall IslandsMauritaniaMauritiusMexicoMicronesia, Fed. Sts.Middle East & North AfricaMiddle East & North Africa (excluding high income)Middle East & North Africa (IDA & IBRD countries)Middle incomeMoldovaMongoliaMontenegroMoroccoMozambiqueMyanmarNamibiaNepalNetherlandsNew ZealandNicaraguaNigerNigeriaNorth AmericaNorwayOECD membersOmanOther small statesPakistanPalauPanamaParaguayPeruPhilippinesPolandPortugalPost-demographic dividendPre-demographic dividendPuerto RicoQatarRomaniaRussian FederationRwandaSamoaSao Tome and PrincipeSaudi ArabiaSenegalSerbiaSeychellesSierra LeoneSingaporeSlovak RepublicSloveniaSmall statesSouth AfricaSouth AsiaSouth Asia (IDA & IBRD)SpainSri LankaSt. Kitts and NevisSt. LuciaSt. Vincent and the GrenadinesSub-Saharan Africa Sub-Saharan Africa (excluding high income)Sub-Saharan Africa (IDA & IBRD countries)SudanSurinameSwazilandSwedenSwitzerlandTajikistanTanzaniaThailandTimor-LesteTogoTongaTrinidad and TobagoTunisiaTurkeyTurkmenistanTuvaluUgandaUkraineUnited Arab EmiratesUnited KingdomUnited StatesUpper middle incomeUruguayUzbekistanVanuatuVenezuela, RBVietnamWest Bank and GazaWorldYemen, Rep.ZambiaZimbabwe Timeline:
This timeline shows a graph from 1981 to 2016 of Zambia. No data until 1980. Number of actual observations by date: 36.
Source name:
World Development Indicators
Source organization:
Derived from World Bank national accounts files and Food and Agriculture Organization, Production Yearbook and data files.
Categories, topics:
Agriculture & Rural Development
Last updated:
apr 23, 2017
Indicators value changes by year
Minimum:
517.321
jan 1, 2016
Maximum:
1.013K
jan 1, 1982
At the date of observation
Value
Absolute change
Change from previous value
jan 1, 1981
966.212
+966.212
0.0%
jan 1, 1982
1.013K
+46.745
4.84%
jan 1, 1983
861.945
-151.013
-14.91%
jan 1, 1984
899.541
+37.596
4.36%
jan 1, 1985
914.911
+15.37
1.71%
jan 1, 1986
904.589
-10.322
-1.13%
jan 1, 1987
939.985
+35.397
3.91%
jan 1, 1988
879.046
-60.939
-6.48%
jan 1, 1989
1.005K
+125.687
14.3%
jan 1, 1990
938.361
-66.373
-6.61%
jan 1, 1991
823.159
-115.202
-12.28%
jan 1, 1992
840.683
+17.524
2.13%
jan 1, 1993
552.249
-288.433
-34.31%
jan 1, 1994
911.145
+358.896
64.99%
jan 1, 1995
727.241
-183.904
-20.18%
jan 1, 1996
946.542
+219.301
30.16%
jan 1, 1997
915.168
-31.374
-3.31%
jan 1, 1998
843.731
-71.437
-7.81%
jan 1, 1999
830.198
-13.533
-1.6%
jan 1, 2000
887.391
+57.193
6.89%
jan 1, 2001
874.286
-13.105
-1.48%
jan 1, 2002
826.041
-48.246
-5.52%
jan 1, 2003
786.238
-39.802
-4.82%
jan 1, 2004
797.504
+11.265
1.43%
jan 1, 2005
798.245
+0.742
0.09%
jan 1, 2006
758.145
-40.101
-5.02%
jan 1, 2007
734.852
-23.292
-3.07%
jan 1, 2008
691.645
-43.208
-5.88%
jan 1, 2009
658.558
-33.087
-4.78%
jan 1, 2010
647.305
-11.253
-1.71%
jan 1, 2011
593.846
-53.459
-8.26%
jan 1, 2012
623.741
+29.895
5.03%
jan 1, 2013
627.913
+4.172
0.67%
jan 1, 2014
587.313
-40.6
-6.47%
jan 1, 2015
577.133
-10.18
-1.73%
jan 1, 2016
517.321
-59.813
-10.36%
Ranking of countries by current statistics by years


Comments: