29
/
en
AIzaSyAYiBZKx7MnpbEhh9jyipgxe19OcubqV5w
April 1, 2024
280597
Venezuela, RB
VEN
true
2
1
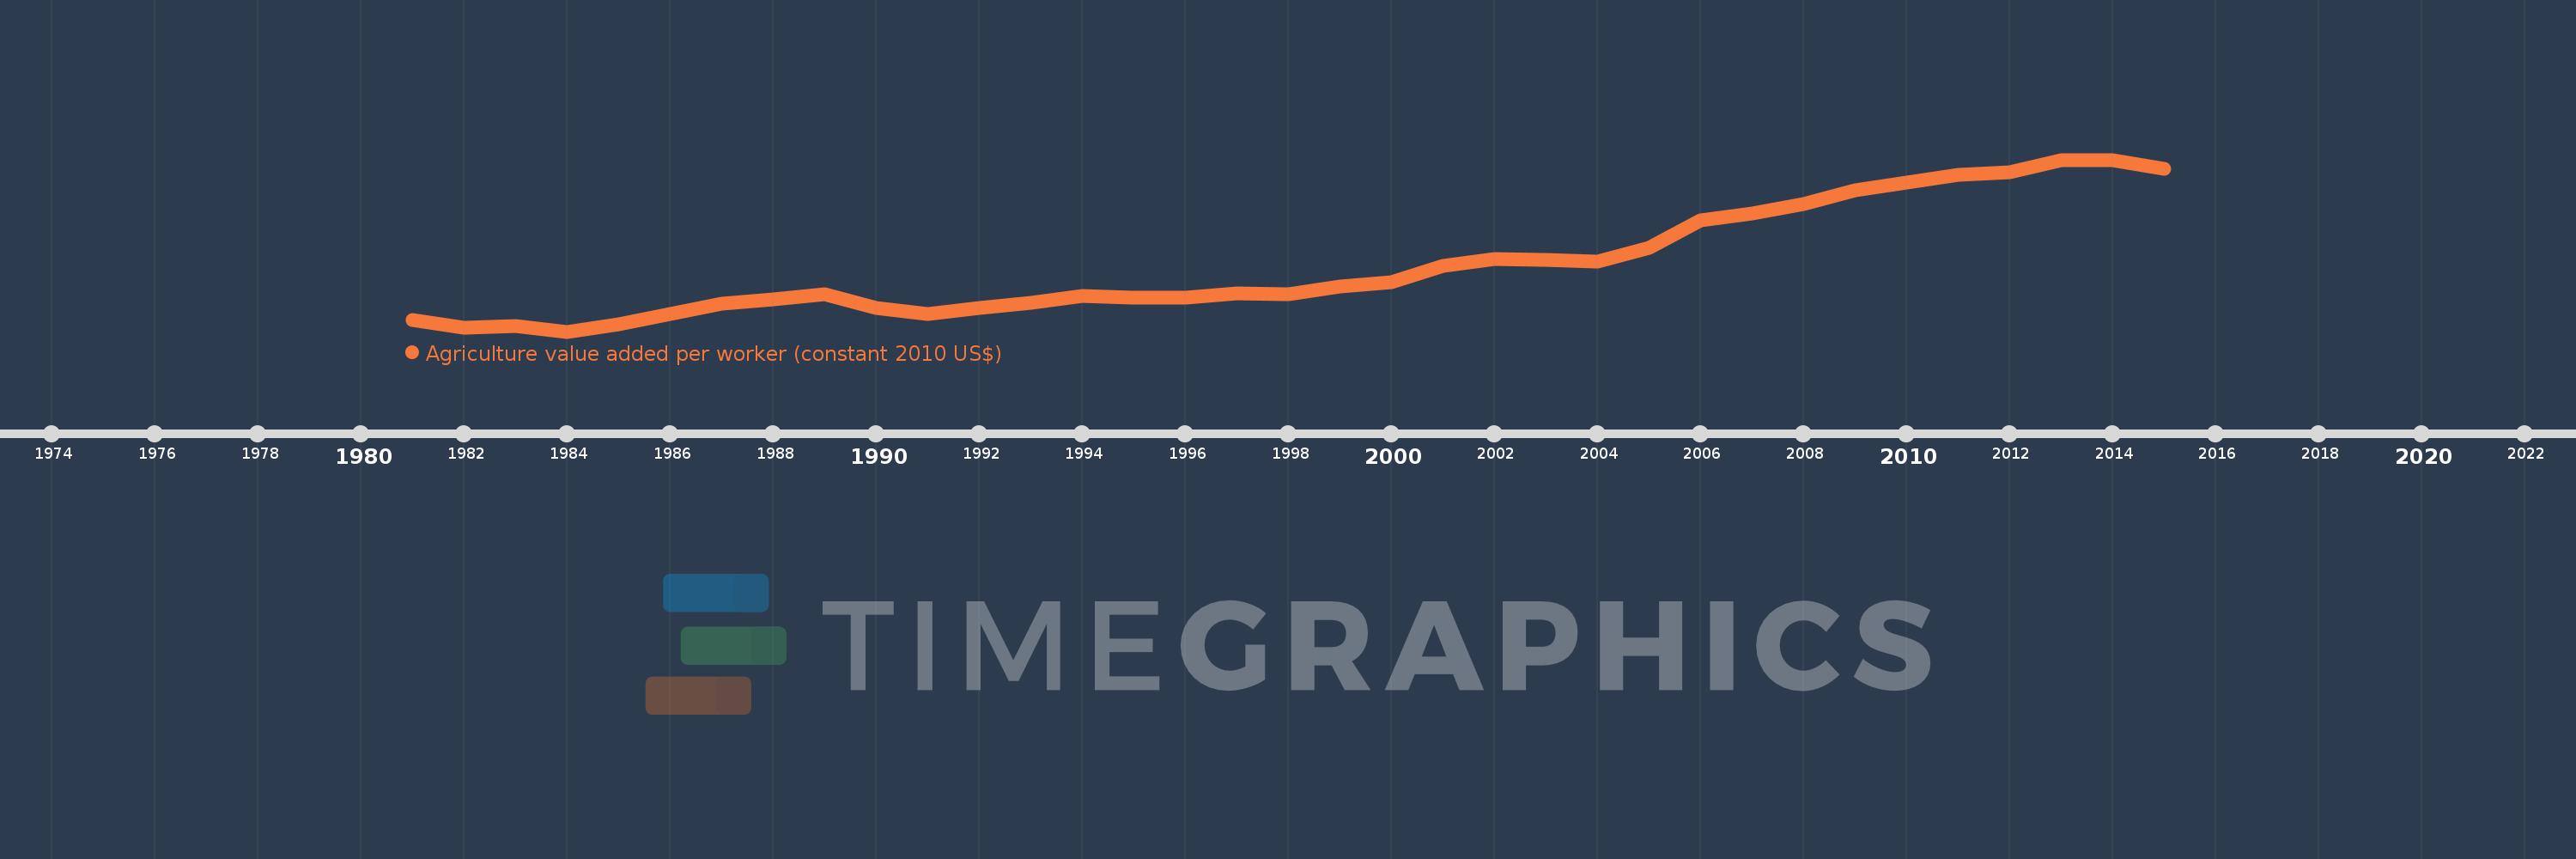
Agriculture value added per worker (constant 2010 US$)
2015,2014,2013,2012,2011,2010,2009,2008,2007,2006,2005,2004,2003,2002,2001,2000,1999,1998,1997,1996,1995,1994,1993,1992,1991,1990,1989,1988,1987,1986,1985,1984,1983,1982,1981
This statistics in other country:
AfghanistanAlbaniaAlgeriaAndorraAntigua and BarbudaArab WorldArgentinaArmeniaArubaAustraliaAustriaAzerbaijanBahamas, TheBahrainBangladeshBarbadosBelarusBelgiumBelizeBeninBermudaBhutanBoliviaBosnia and HerzegovinaBotswanaBrazilBrunei DarussalamBulgariaBurkina FasoBurundiCabo VerdeCambodiaCameroonCanadaCaribbean small statesCentral African RepublicCentral Europe and the BalticsChadChileChinaColombiaComorosCongo, Dem. Rep.Congo, Rep.Costa RicaCote d'IvoireCroatiaCubaCyprusCzech RepublicDenmarkDominicaDominican RepublicEarly-demographic dividendEast Asia & PacificEast Asia & Pacific (excluding high income)East Asia & Pacific (IDA & IBRD countries)EcuadorEgypt, Arab Rep.El SalvadorEquatorial GuineaEstoniaEthiopiaEuro areaEurope & Central AsiaEurope & Central Asia (excluding high income)Europe & Central Asia (IDA & IBRD countries)European UnionFijiFinlandFragile and conflict affected situationsFranceGabonGambia, TheGeorgiaGermanyGhanaGreeceGrenadaGuatemalaGuineaGuinea-BissauGuyanaHeavily indebted poor countries (HIPC)High incomeHondurasHungaryIBRD onlyIcelandIDA & IBRD totalIDA blendIDA onlyIDA totalIndiaIndonesiaIran, Islamic Rep.IraqIrelandItalyJamaicaJapanJordanKazakhstanKenyaKiribatiKorea, Rep.KuwaitKyrgyz RepublicLao PDRLate-demographic dividendLatin America & Caribbean Latin America & Caribbean (excluding high income)Latin America & the Caribbean (IDA & IBRD countries)LatviaLeast developed countries: UN classificationLebanonLesothoLiberiaLithuaniaLow & middle incomeLow incomeLower middle incomeLuxembourgMacedonia, FYRMadagascarMalawiMalaysiaMaldivesMaliMaltaMarshall IslandsMauritaniaMauritiusMexicoMicronesia, Fed. Sts.Middle East & North AfricaMiddle East & North Africa (excluding high income)Middle East & North Africa (IDA & IBRD countries)Middle incomeMoldovaMongoliaMontenegroMoroccoMozambiqueMyanmarNamibiaNepalNetherlandsNew ZealandNicaraguaNigerNigeriaNorth AmericaNorwayOECD membersOmanOther small statesPakistanPalauPanamaParaguayPeruPhilippinesPolandPortugalPost-demographic dividendPre-demographic dividendPuerto RicoQatarRomaniaRussian FederationRwandaSamoaSao Tome and PrincipeSaudi ArabiaSenegalSerbiaSeychellesSierra LeoneSingaporeSlovak RepublicSloveniaSmall statesSouth AfricaSouth AsiaSouth Asia (IDA & IBRD)SpainSri LankaSt. Kitts and NevisSt. LuciaSt. Vincent and the GrenadinesSub-Saharan Africa Sub-Saharan Africa (excluding high income)Sub-Saharan Africa (IDA & IBRD countries)SudanSurinameSwazilandSwedenSwitzerlandTajikistanTanzaniaThailandTimor-LesteTogoTongaTrinidad and TobagoTunisiaTurkeyTurkmenistanTuvaluUgandaUkraineUnited Arab EmiratesUnited KingdomUnited StatesUpper middle incomeUruguayUzbekistanVanuatuVenezuela, RBVietnamWest Bank and GazaWorldYemen, Rep.ZambiaZimbabwe Timeline:
This timeline shows a graph from 1981 to 2015 of Venezuela, RB. No data until 1980. Number of actual observations by date: 35.
Source name:
World Development Indicators
Source organization:
Derived from World Bank national accounts files and Food and Agriculture Organization, Production Yearbook and data files.
Categories, topics:
Agriculture & Rural Development
Last updated:
apr 23, 2017
Indicators value changes by year
Minimum:
14.686K
jan 1, 1984
Maximum:
30.727K
jan 1, 2014
At the date of observation
Value
Absolute change
Change from previous value
jan 1, 1981
15.766K
+15.766K
0.0%
jan 1, 1982
15.072K
-694.184
-4.4%
jan 1, 1983
15.196K
+124.705
0.83%
jan 1, 1984
14.686K
-510.885
-3.36%
jan 1, 1985
15.381K
+695.127
4.73%
jan 1, 1986
16.316K
+935.785
6.08%
jan 1, 1987
17.328K
+1.011K
6.2%
jan 1, 1988
17.688K
+360.147
2.08%
jan 1, 1989
18.199K
+510.603
2.89%
jan 1, 1990
16.902K
-1.297K
-7.12%
jan 1, 1991
16.357K
-544.849
-3.22%
jan 1, 1992
16.897K
+539.525
3.3%
jan 1, 1993
17.38K
+483.137
2.86%
jan 1, 1994
17.99K
+610.211
3.51%
jan 1, 1995
17.833K
-156.604
-0.87%
jan 1, 1996
17.821K
-12.425
-0.07%
jan 1, 1997
18.258K
+437.179
2.45%
jan 1, 1998
18.175K
-82.803
-0.45%
jan 1, 1999
18.925K
+749.714
4.12%
jan 1, 2000
19.326K
+400.917
2.12%
jan 1, 2001
20.845K
+1.519K
7.86%
jan 1, 2002
21.455K
+609.811
2.93%
jan 1, 2003
21.363K
-91.945
-0.43%
jan 1, 2004
21.216K
-147.191
-0.69%
jan 1, 2005
22.513K
+1.297K
6.11%
jan 1, 2006
25.079K
+2.567K
11.4%
jan 1, 2007
25.705K
+625.678
2.49%
jan 1, 2008
26.58K
+874.869
3.4%
jan 1, 2009
27.876K
+1.296K
4.87%
jan 1, 2010
28.576K
+700.688
2.51%
jan 1, 2011
29.318K
+742.149
2.6%
jan 1, 2012
29.57K
+251.282
0.86%
jan 1, 2013
30.674K
+1.104K
3.73%
jan 1, 2014
30.727K
+53.482
0.17%
jan 1, 2015
29.892K
-835.555
-2.72%
Ranking of countries by current statistics by years


Comments: