29
/
en
AIzaSyAYiBZKx7MnpbEhh9jyipgxe19OcubqV5w
April 1, 2024
286823
Zimbabwe
ZWE
true
2
1
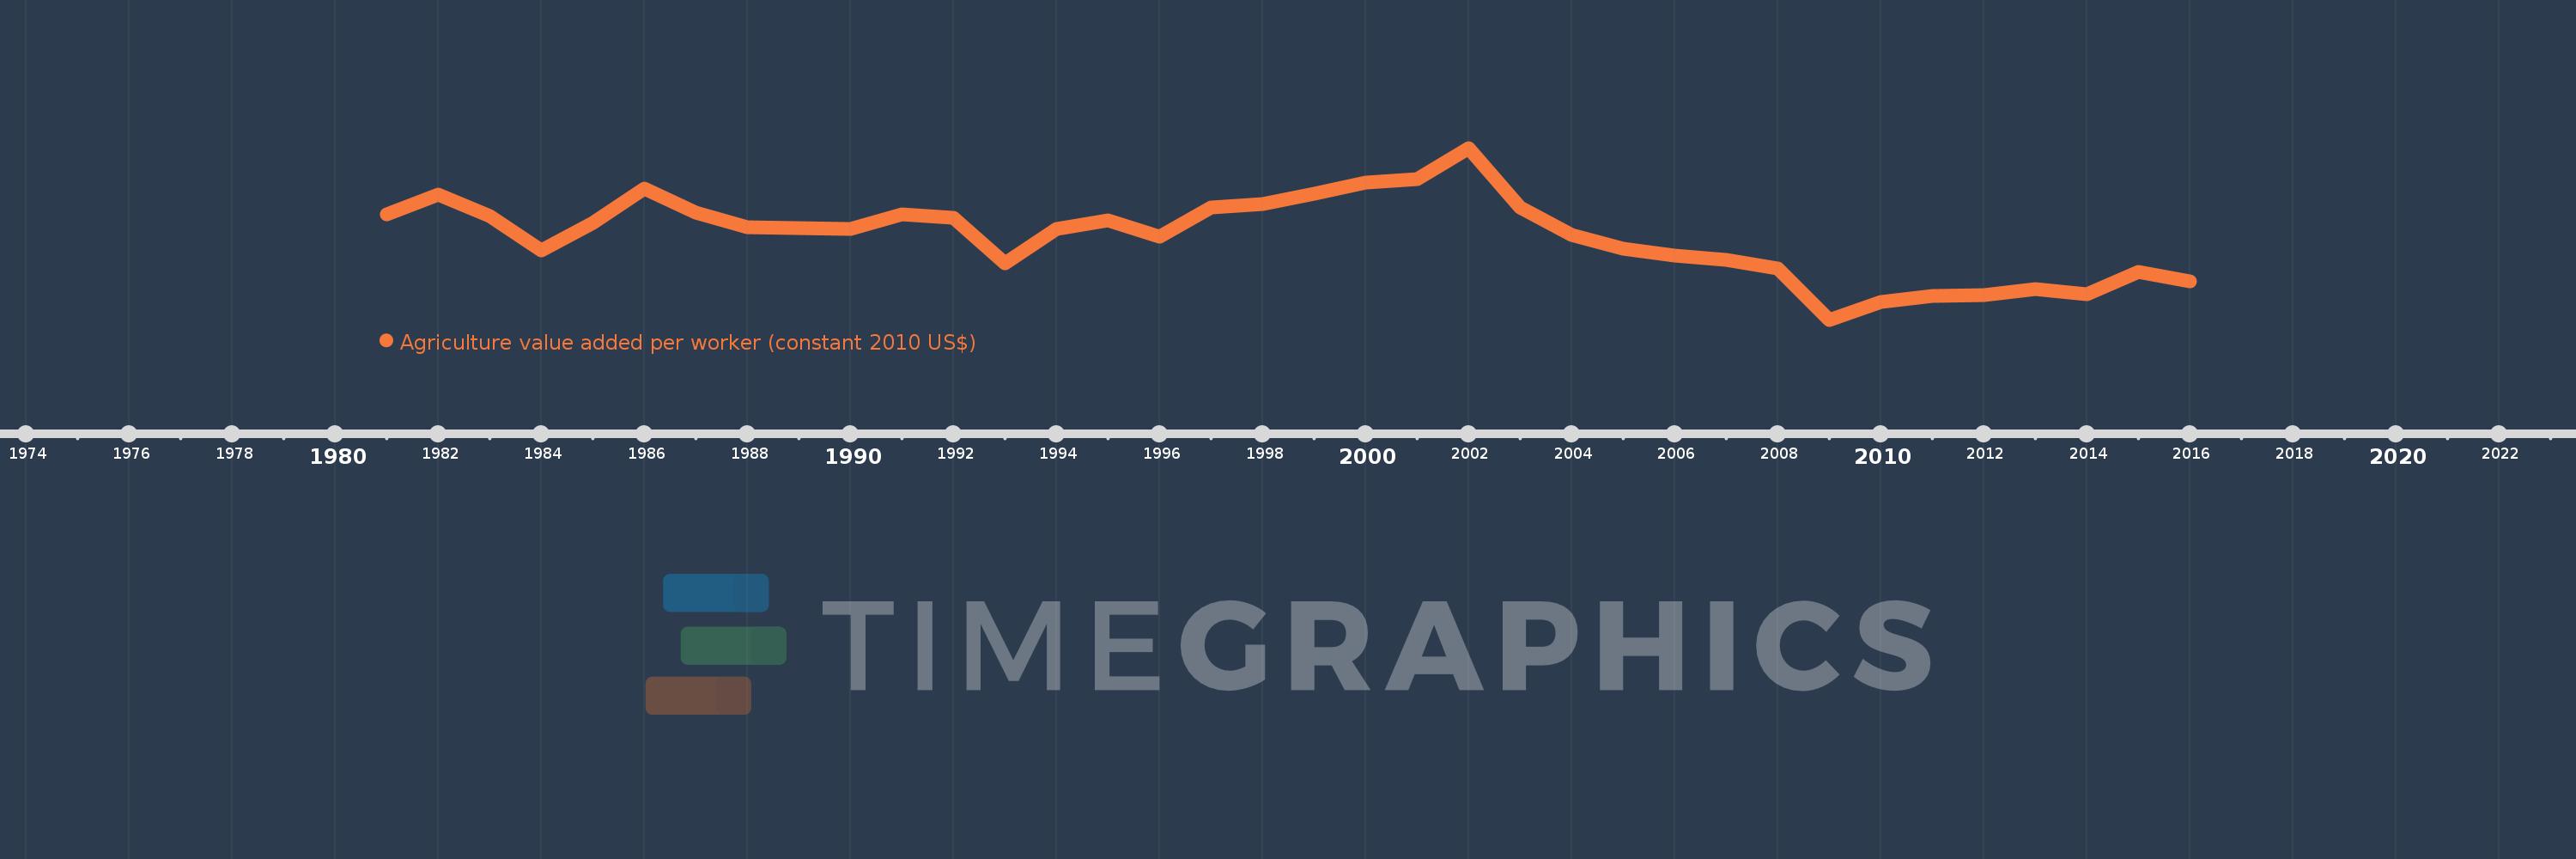
Agriculture value added per worker (constant 2010 US$)
2016,2015,2014,2013,2012,2011,2010,2009,2008,2007,2006,2005,2004,2003,2002,2001,2000,1999,1998,1997,1996,1995,1994,1993,1992,1991,1990,1989,1988,1987,1986,1985,1984,1983,1982,1981
This statistics in other country:
AfghanistanAlbaniaAlgeriaAndorraAntigua and BarbudaArab WorldArgentinaArmeniaArubaAustraliaAustriaAzerbaijanBahamas, TheBahrainBangladeshBarbadosBelarusBelgiumBelizeBeninBermudaBhutanBoliviaBosnia and HerzegovinaBotswanaBrazilBrunei DarussalamBulgariaBurkina FasoBurundiCabo VerdeCambodiaCameroonCanadaCaribbean small statesCentral African RepublicCentral Europe and the BalticsChadChileChinaColombiaComorosCongo, Dem. Rep.Congo, Rep.Costa RicaCote d'IvoireCroatiaCubaCyprusCzech RepublicDenmarkDominicaDominican RepublicEarly-demographic dividendEast Asia & PacificEast Asia & Pacific (excluding high income)East Asia & Pacific (IDA & IBRD countries)EcuadorEgypt, Arab Rep.El SalvadorEquatorial GuineaEstoniaEthiopiaEuro areaEurope & Central AsiaEurope & Central Asia (excluding high income)Europe & Central Asia (IDA & IBRD countries)European UnionFijiFinlandFragile and conflict affected situationsFranceGabonGambia, TheGeorgiaGermanyGhanaGreeceGrenadaGuatemalaGuineaGuinea-BissauGuyanaHeavily indebted poor countries (HIPC)High incomeHondurasHungaryIBRD onlyIcelandIDA & IBRD totalIDA blendIDA onlyIDA totalIndiaIndonesiaIran, Islamic Rep.IraqIrelandItalyJamaicaJapanJordanKazakhstanKenyaKiribatiKorea, Rep.KuwaitKyrgyz RepublicLao PDRLate-demographic dividendLatin America & Caribbean Latin America & Caribbean (excluding high income)Latin America & the Caribbean (IDA & IBRD countries)LatviaLeast developed countries: UN classificationLebanonLesothoLiberiaLithuaniaLow & middle incomeLow incomeLower middle incomeLuxembourgMacedonia, FYRMadagascarMalawiMalaysiaMaldivesMaliMaltaMarshall IslandsMauritaniaMauritiusMexicoMicronesia, Fed. Sts.Middle East & North AfricaMiddle East & North Africa (excluding high income)Middle East & North Africa (IDA & IBRD countries)Middle incomeMoldovaMongoliaMontenegroMoroccoMozambiqueMyanmarNamibiaNepalNetherlandsNew ZealandNicaraguaNigerNigeriaNorth AmericaNorwayOECD membersOmanOther small statesPakistanPalauPanamaParaguayPeruPhilippinesPolandPortugalPost-demographic dividendPre-demographic dividendPuerto RicoQatarRomaniaRussian FederationRwandaSamoaSao Tome and PrincipeSaudi ArabiaSenegalSerbiaSeychellesSierra LeoneSingaporeSlovak RepublicSloveniaSmall statesSouth AfricaSouth AsiaSouth Asia (IDA & IBRD)SpainSri LankaSt. Kitts and NevisSt. LuciaSt. Vincent and the GrenadinesSub-Saharan Africa Sub-Saharan Africa (excluding high income)Sub-Saharan Africa (IDA & IBRD countries)SudanSurinameSwazilandSwedenSwitzerlandTajikistanTanzaniaThailandTimor-LesteTogoTongaTrinidad and TobagoTunisiaTurkeyTurkmenistanTuvaluUgandaUkraineUnited Arab EmiratesUnited KingdomUnited StatesUpper middle incomeUruguayUzbekistanVanuatuVenezuela, RBVietnamWest Bank and GazaWorldYemen, Rep.ZambiaZimbabwe Timeline:
This timeline shows a graph from 1981 to 2016 of Zimbabwe. No data until 1980. Number of actual observations by date: 36.
Source name:
World Development Indicators
Source organization:
Derived from World Bank national accounts files and Food and Agriculture Organization, Production Yearbook and data files.
Categories, topics:
Agriculture & Rural Development
Last updated:
apr 23, 2017
Indicators value changes by year
Minimum:
285.163
jan 1, 2009
Maximum:
894.907
jan 1, 2002
At the date of observation
Value
Absolute change
Change from previous value
jan 1, 1981
660.574
+660.574
0.0%
jan 1, 1982
728.818
+68.244
10.33%
jan 1, 1983
652.511
-76.307
-10.47%
jan 1, 1984
529.892
-122.62
-18.79%
jan 1, 1985
628.762
+98.87
18.66%
jan 1, 1986
749.816
+121.054
19.25%
jan 1, 1987
663.828
-85.987
-11.47%
jan 1, 1988
613.726
-50.103
-7.55%
jan 1, 1989
608.966
-4.76
-0.78%
jan 1, 1990
607.785
-1.181
-0.19%
jan 1, 1991
659.455
+51.67
8.5%
jan 1, 1992
648.213
-11.242
-1.7%
jan 1, 1993
486.664
-161.549
-24.92%
jan 1, 1994
606.008
+119.343
24.52%
jan 1, 1995
637.903
+31.896
5.26%
jan 1, 1996
579.735
-58.168
-9.12%
jan 1, 1997
683.266
+103.531
17.86%
jan 1, 1998
694.934
+11.667
1.71%
jan 1, 1999
732.471
+37.537
5.4%
jan 1, 2000
771.267
+38.797
5.3%
jan 1, 2001
784.286
+13.019
1.69%
jan 1, 2002
894.907
+110.621
14.1%
jan 1, 2003
682.638
-212.27
-23.72%
jan 1, 2004
584.554
-98.084
-14.37%
jan 1, 2005
536.428
-48.126
-8.23%
jan 1, 2006
514.101
-22.327
-4.16%
jan 1, 2007
497.928
-16.173
-3.15%
jan 1, 2008
467.53
-30.398
-6.1%
jan 1, 2009
285.163
-182.367
-39.01%
jan 1, 2010
348.036
+62.874
22.05%
jan 1, 2011
371.131
+23.095
6.64%
jan 1, 2012
371.933
+0.802
0.22%
jan 1, 2013
394.317
+22.383
6.02%
jan 1, 2014
376.519
-17.797
-4.51%
jan 1, 2015
453.75
+77.231
20.51%
jan 1, 2016
422.179
-31.571
-6.96%
Ranking of countries by current statistics by years


Comments: