29
/
en
AIzaSyAYiBZKx7MnpbEhh9jyipgxe19OcubqV5w
April 1, 2024
173779
Lao PDR
LAO
true
2
1
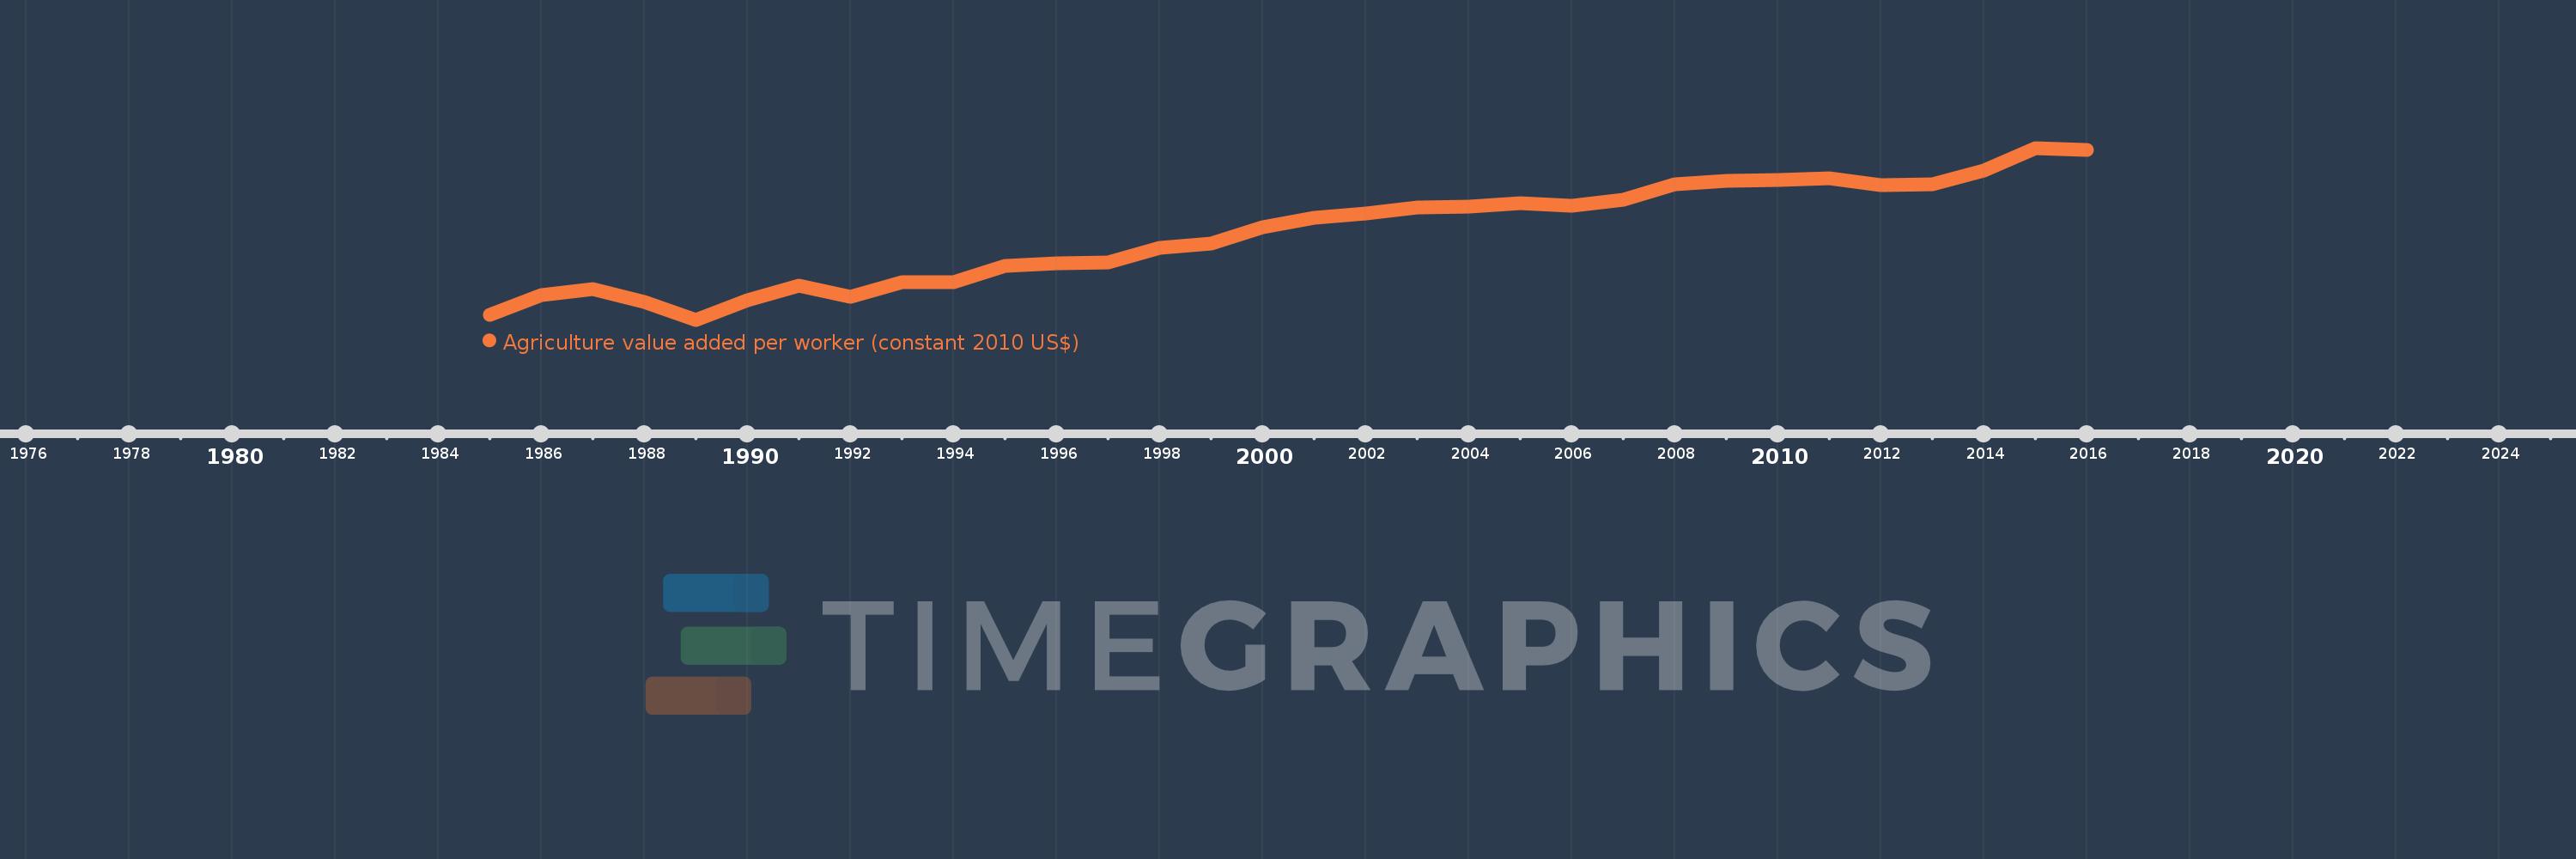
Agriculture value added per worker (constant 2010 US$)
2016,2015,2014,2013,2012,2011,2010,2009,2008,2007,2006,2005,2004,2003,2002,2001,2000,1999,1998,1997,1996,1995,1994,1993,1992,1991,1990,1989,1988,1987,1986,1985
This statistics in other country:
AfghanistanAlbaniaAlgeriaAndorraAntigua and BarbudaArab WorldArgentinaArmeniaArubaAustraliaAustriaAzerbaijanBahamas, TheBahrainBangladeshBarbadosBelarusBelgiumBelizeBeninBermudaBhutanBoliviaBosnia and HerzegovinaBotswanaBrazilBrunei DarussalamBulgariaBurkina FasoBurundiCabo VerdeCambodiaCameroonCanadaCaribbean small statesCentral African RepublicCentral Europe and the BalticsChadChileChinaColombiaComorosCongo, Dem. Rep.Congo, Rep.Costa RicaCote d'IvoireCroatiaCubaCyprusCzech RepublicDenmarkDominicaDominican RepublicEarly-demographic dividendEast Asia & PacificEast Asia & Pacific (excluding high income)East Asia & Pacific (IDA & IBRD countries)EcuadorEgypt, Arab Rep.El SalvadorEquatorial GuineaEstoniaEthiopiaEuro areaEurope & Central AsiaEurope & Central Asia (excluding high income)Europe & Central Asia (IDA & IBRD countries)European UnionFijiFinlandFragile and conflict affected situationsFranceGabonGambia, TheGeorgiaGermanyGhanaGreeceGrenadaGuatemalaGuineaGuinea-BissauGuyanaHeavily indebted poor countries (HIPC)High incomeHondurasHungaryIBRD onlyIcelandIDA & IBRD totalIDA blendIDA onlyIDA totalIndiaIndonesiaIran, Islamic Rep.IraqIrelandItalyJamaicaJapanJordanKazakhstanKenyaKiribatiKorea, Rep.KuwaitKyrgyz RepublicLao PDRLate-demographic dividendLatin America & Caribbean Latin America & Caribbean (excluding high income)Latin America & the Caribbean (IDA & IBRD countries)LatviaLeast developed countries: UN classificationLebanonLesothoLiberiaLithuaniaLow & middle incomeLow incomeLower middle incomeLuxembourgMacedonia, FYRMadagascarMalawiMalaysiaMaldivesMaliMaltaMarshall IslandsMauritaniaMauritiusMexicoMicronesia, Fed. Sts.Middle East & North AfricaMiddle East & North Africa (excluding high income)Middle East & North Africa (IDA & IBRD countries)Middle incomeMoldovaMongoliaMontenegroMoroccoMozambiqueMyanmarNamibiaNepalNetherlandsNew ZealandNicaraguaNigerNigeriaNorth AmericaNorwayOECD membersOmanOther small statesPakistanPalauPanamaParaguayPeruPhilippinesPolandPortugalPost-demographic dividendPre-demographic dividendPuerto RicoQatarRomaniaRussian FederationRwandaSamoaSao Tome and PrincipeSaudi ArabiaSenegalSerbiaSeychellesSierra LeoneSingaporeSlovak RepublicSloveniaSmall statesSouth AfricaSouth AsiaSouth Asia (IDA & IBRD)SpainSri LankaSt. Kitts and NevisSt. LuciaSt. Vincent and the GrenadinesSub-Saharan Africa Sub-Saharan Africa (excluding high income)Sub-Saharan Africa (IDA & IBRD countries)SudanSurinameSwazilandSwedenSwitzerlandTajikistanTanzaniaThailandTimor-LesteTogoTongaTrinidad and TobagoTunisiaTurkeyTurkmenistanTuvaluUgandaUkraineUnited Arab EmiratesUnited KingdomUnited StatesUpper middle incomeUruguayUzbekistanVanuatuVenezuela, RBVietnamWest Bank and GazaWorldYemen, Rep.ZambiaZimbabwe Timeline:
This timeline shows a graph from 1985 to 2016 of Lao PDR. No data until 1984. Number of actual observations by date: 32.
Source name:
World Development Indicators
Source organization:
Derived from World Bank national accounts files and Food and Agriculture Organization, Production Yearbook and data files.
Categories, topics:
Agriculture & Rural Development
Last updated:
apr 23, 2017
Indicators value changes by year
Minimum:
556.571
jan 1, 1989
Maximum:
966.119
jan 1, 2015
At the date of observation
Value
Absolute change
Change from previous value
jan 1, 1985
568.349
+568.349
0.0%
jan 1, 1986
614.598
+46.25
8.14%
jan 1, 1987
629.095
+14.497
2.36%
jan 1, 1988
599.075
-30.021
-4.77%
jan 1, 1989
556.571
-42.503
-7.09%
jan 1, 1990
603.371
+46.799
8.41%
jan 1, 1991
638.798
+35.427
5.87%
jan 1, 1992
611.178
-27.619
-4.32%
jan 1, 1993
645.215
+34.037
5.57%
jan 1, 1994
646.559
+1.344
0.21%
jan 1, 1995
684.413
+37.854
5.85%
jan 1, 1996
690.364
+5.951
0.87%
jan 1, 1997
693.29
+2.926
0.42%
jan 1, 1998
727.544
+34.254
4.94%
jan 1, 1999
737.824
+10.28
1.41%
jan 1, 2000
776.831
+39.006
5.29%
jan 1, 2001
798.931
+22.1
2.84%
jan 1, 2002
810.364
+11.433
1.43%
jan 1, 2003
823.619
+13.255
1.64%
jan 1, 2004
826.1
+2.481
0.3%
jan 1, 2005
833.894
+7.793
0.94%
jan 1, 2006
827.873
-6.02
-0.72%
jan 1, 2007
842.125
+14.251
1.72%
jan 1, 2008
880.192
+38.068
4.52%
jan 1, 2009
887.604
+7.411
0.84%
jan 1, 2010
890.21
+2.606
0.29%
jan 1, 2011
893.047
+2.837
0.32%
jan 1, 2012
876.671
-16.377
-1.83%
jan 1, 2013
880.472
+3.801
0.43%
jan 1, 2014
912.617
+32.145
3.65%
jan 1, 2015
966.119
+53.502
5.86%
jan 1, 2016
961.054
-5.064
-0.52%
Ranking of countries by current statistics by years


Comments: