29
/
en
AIzaSyAYiBZKx7MnpbEhh9jyipgxe19OcubqV5w
April 1, 2024
68585
Antigua and Barbuda
ATG
true
2
1
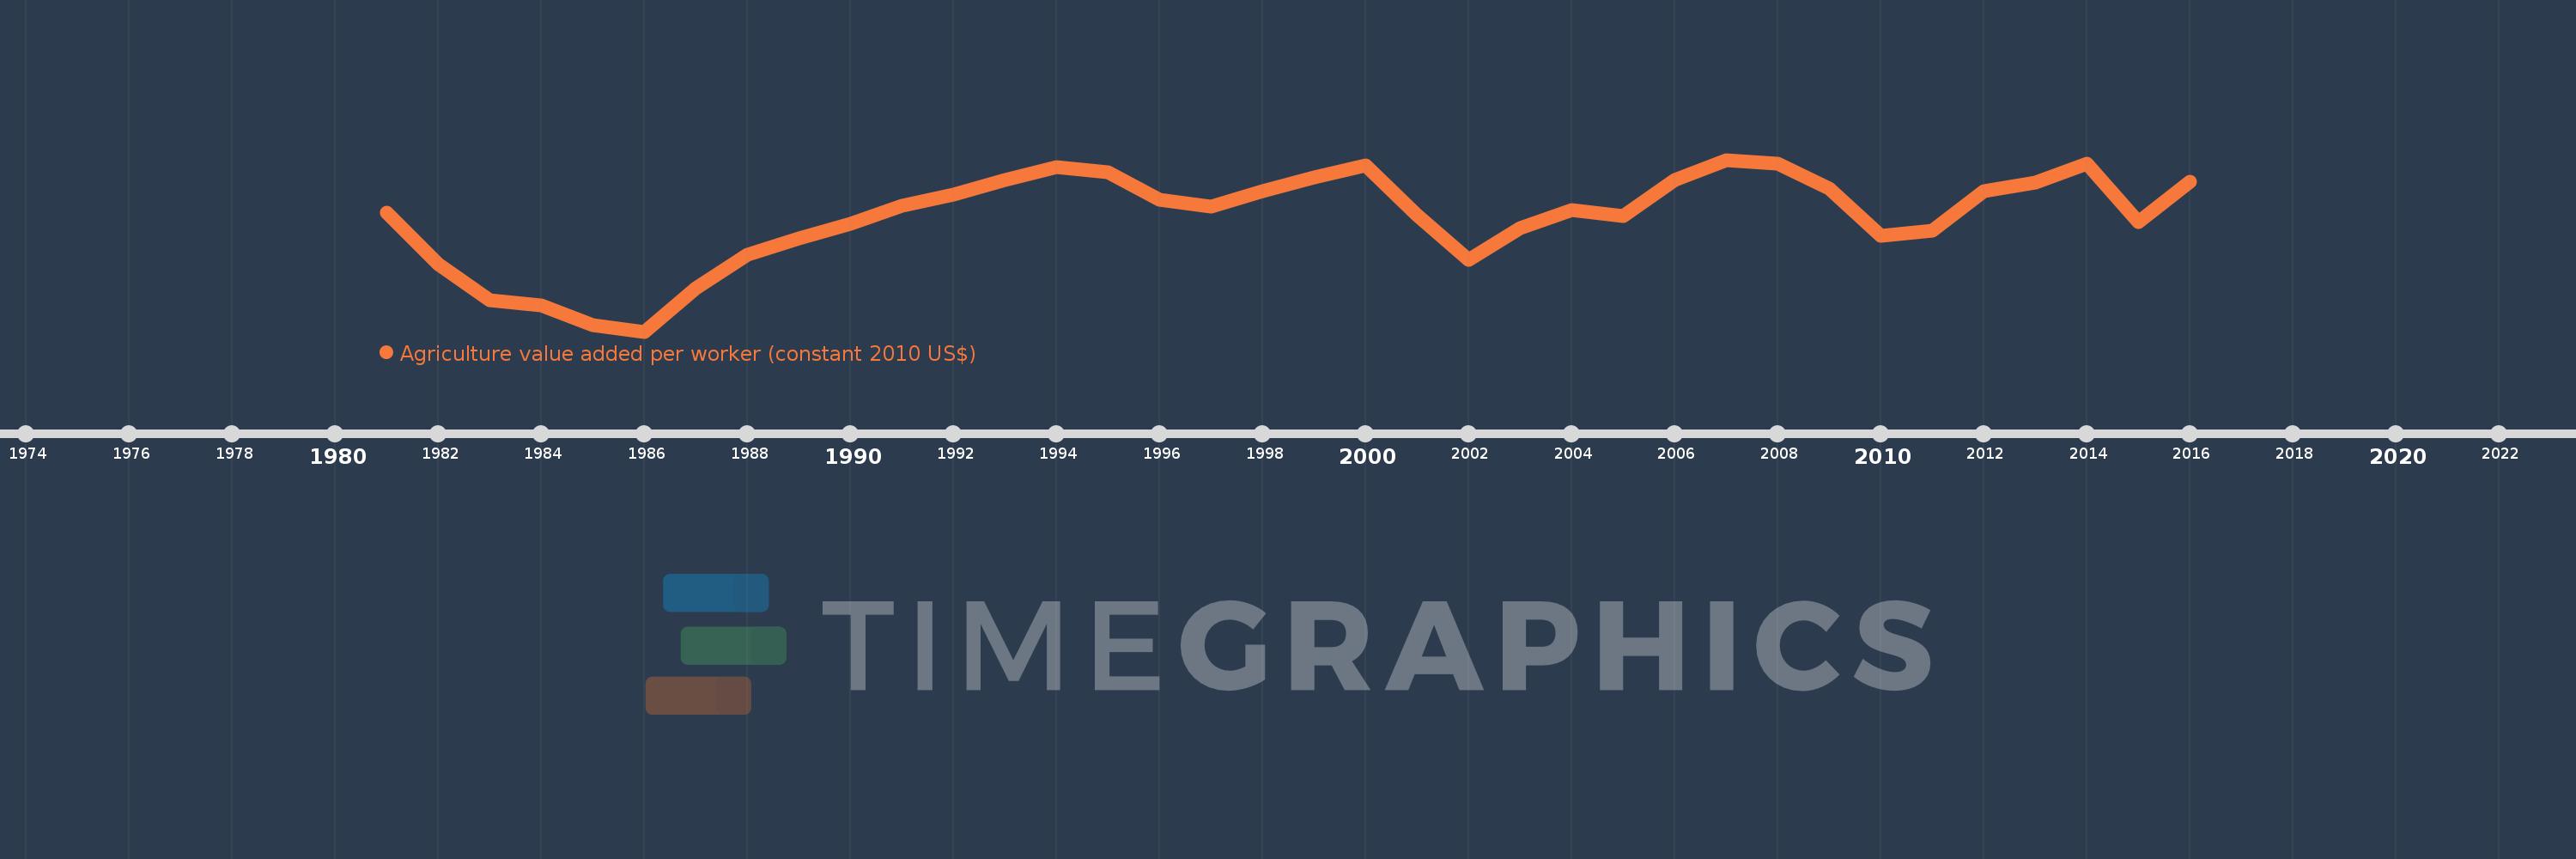
Agriculture value added per worker (constant 2010 US$)
2016,2015,2014,2013,2012,2011,2010,2009,2008,2007,2006,2005,2004,2003,2002,2001,2000,1999,1998,1997,1996,1995,1994,1993,1992,1991,1990,1989,1988,1987,1986,1985,1984,1983,1982,1981
This statistics in other country:
AfghanistanAlbaniaAlgeriaAndorraAntigua and BarbudaArab WorldArgentinaArmeniaArubaAustraliaAustriaAzerbaijanBahamas, TheBahrainBangladeshBarbadosBelarusBelgiumBelizeBeninBermudaBhutanBoliviaBosnia and HerzegovinaBotswanaBrazilBrunei DarussalamBulgariaBurkina FasoBurundiCabo VerdeCambodiaCameroonCanadaCaribbean small statesCentral African RepublicCentral Europe and the BalticsChadChileChinaColombiaComorosCongo, Dem. Rep.Congo, Rep.Costa RicaCote d'IvoireCroatiaCubaCyprusCzech RepublicDenmarkDominicaDominican RepublicEarly-demographic dividendEast Asia & PacificEast Asia & Pacific (excluding high income)East Asia & Pacific (IDA & IBRD countries)EcuadorEgypt, Arab Rep.El SalvadorEquatorial GuineaEstoniaEthiopiaEuro areaEurope & Central AsiaEurope & Central Asia (excluding high income)Europe & Central Asia (IDA & IBRD countries)European UnionFijiFinlandFragile and conflict affected situationsFranceGabonGambia, TheGeorgiaGermanyGhanaGreeceGrenadaGuatemalaGuineaGuinea-BissauGuyanaHeavily indebted poor countries (HIPC)High incomeHondurasHungaryIBRD onlyIcelandIDA & IBRD totalIDA blendIDA onlyIDA totalIndiaIndonesiaIran, Islamic Rep.IraqIrelandItalyJamaicaJapanJordanKazakhstanKenyaKiribatiKorea, Rep.KuwaitKyrgyz RepublicLao PDRLate-demographic dividendLatin America & Caribbean Latin America & Caribbean (excluding high income)Latin America & the Caribbean (IDA & IBRD countries)LatviaLeast developed countries: UN classificationLebanonLesothoLiberiaLithuaniaLow & middle incomeLow incomeLower middle incomeLuxembourgMacedonia, FYRMadagascarMalawiMalaysiaMaldivesMaliMaltaMarshall IslandsMauritaniaMauritiusMexicoMicronesia, Fed. Sts.Middle East & North AfricaMiddle East & North Africa (excluding high income)Middle East & North Africa (IDA & IBRD countries)Middle incomeMoldovaMongoliaMontenegroMoroccoMozambiqueMyanmarNamibiaNepalNetherlandsNew ZealandNicaraguaNigerNigeriaNorth AmericaNorwayOECD membersOmanOther small statesPakistanPalauPanamaParaguayPeruPhilippinesPolandPortugalPost-demographic dividendPre-demographic dividendPuerto RicoQatarRomaniaRussian FederationRwandaSamoaSao Tome and PrincipeSaudi ArabiaSenegalSerbiaSeychellesSierra LeoneSingaporeSlovak RepublicSloveniaSmall statesSouth AfricaSouth AsiaSouth Asia (IDA & IBRD)SpainSri LankaSt. Kitts and NevisSt. LuciaSt. Vincent and the GrenadinesSub-Saharan Africa Sub-Saharan Africa (excluding high income)Sub-Saharan Africa (IDA & IBRD countries)SudanSurinameSwazilandSwedenSwitzerlandTajikistanTanzaniaThailandTimor-LesteTogoTongaTrinidad and TobagoTunisiaTurkeyTurkmenistanTuvaluUgandaUkraineUnited Arab EmiratesUnited KingdomUnited StatesUpper middle incomeUruguayUzbekistanVanuatuVenezuela, RBVietnamWest Bank and GazaWorldYemen, Rep.ZambiaZimbabwe Timeline:
This timeline shows a graph from 1981 to 2016 of Antigua and Barbuda. No data until 1980. Number of actual observations by date: 36.
Source name:
World Development Indicators
Source organization:
Derived from World Bank national accounts files and Food and Agriculture Organization, Production Yearbook and data files.
Categories, topics:
Agriculture & Rural Development
Last updated:
apr 23, 2017
Indicators value changes by year
Minimum:
1.547K
jan 1, 1986
Maximum:
2.908K
jan 1, 2007
At the date of observation
Value
Absolute change
Change from previous value
jan 1, 1981
2.486K
+2.486K
0.0%
jan 1, 1982
2.079K
-407.515
-16.39%
jan 1, 1983
1.794K
-285.2
-13.72%
jan 1, 1984
1.755K
-38.78
-2.16%
jan 1, 1985
1.595K
-159.304
-9.08%
jan 1, 1986
1.547K
-48.33
-3.03%
jan 1, 1987
1.888K
+341.028
22.04%
jan 1, 1988
2.156K
+267.98
14.19%
jan 1, 1989
2.285K
+128.88
5.98%
jan 1, 1990
2.402K
+116.602
5.1%
jan 1, 1991
2.545K
+143.875
5.99%
jan 1, 1992
2.633K
+87.282
3.43%
jan 1, 1993
2.746K
+113.191
4.3%
jan 1, 1994
2.852K
+106.376
3.87%
jan 1, 1995
2.809K
-42.962
-1.51%
jan 1, 1996
2.59K
-219.567
-7.82%
jan 1, 1997
2.538K
-51.817
-2.0%
jan 1, 1998
2.66K
+122.053
4.81%
jan 1, 1999
2.768K
+108.422
4.08%
jan 1, 2000
2.864K
+95.462
3.45%
jan 1, 2001
2.47K
-393.54
-13.74%
jan 1, 2002
2.116K
-354.745
-14.36%
jan 1, 2003
2.37K
+254.146
12.01%
jan 1, 2004
2.512K
+141.955
5.99%
jan 1, 2005
2.463K
-49.147
-1.96%
jan 1, 2006
2.751K
+288.624
11.72%
jan 1, 2007
2.908K
+156.86
5.7%
jan 1, 2008
2.881K
-27.327
-0.94%
jan 1, 2009
2.683K
-197.854
-6.87%
jan 1, 2010
2.306K
-377.142
-14.06%
jan 1, 2011
2.345K
+38.988
1.69%
jan 1, 2012
2.663K
+317.82
13.55%
jan 1, 2013
2.727K
+64.851
2.44%
jan 1, 2014
2.879K
+151.331
5.55%
jan 1, 2015
2.417K
-461.504
-16.03%
jan 1, 2016
2.734K
+316.294
13.08%
Ranking of countries by current statistics by years


Comments: