29
/
en
AIzaSyAYiBZKx7MnpbEhh9jyipgxe19OcubqV5w
April 1, 2024
39533
IDA only
IDX
false
2
1
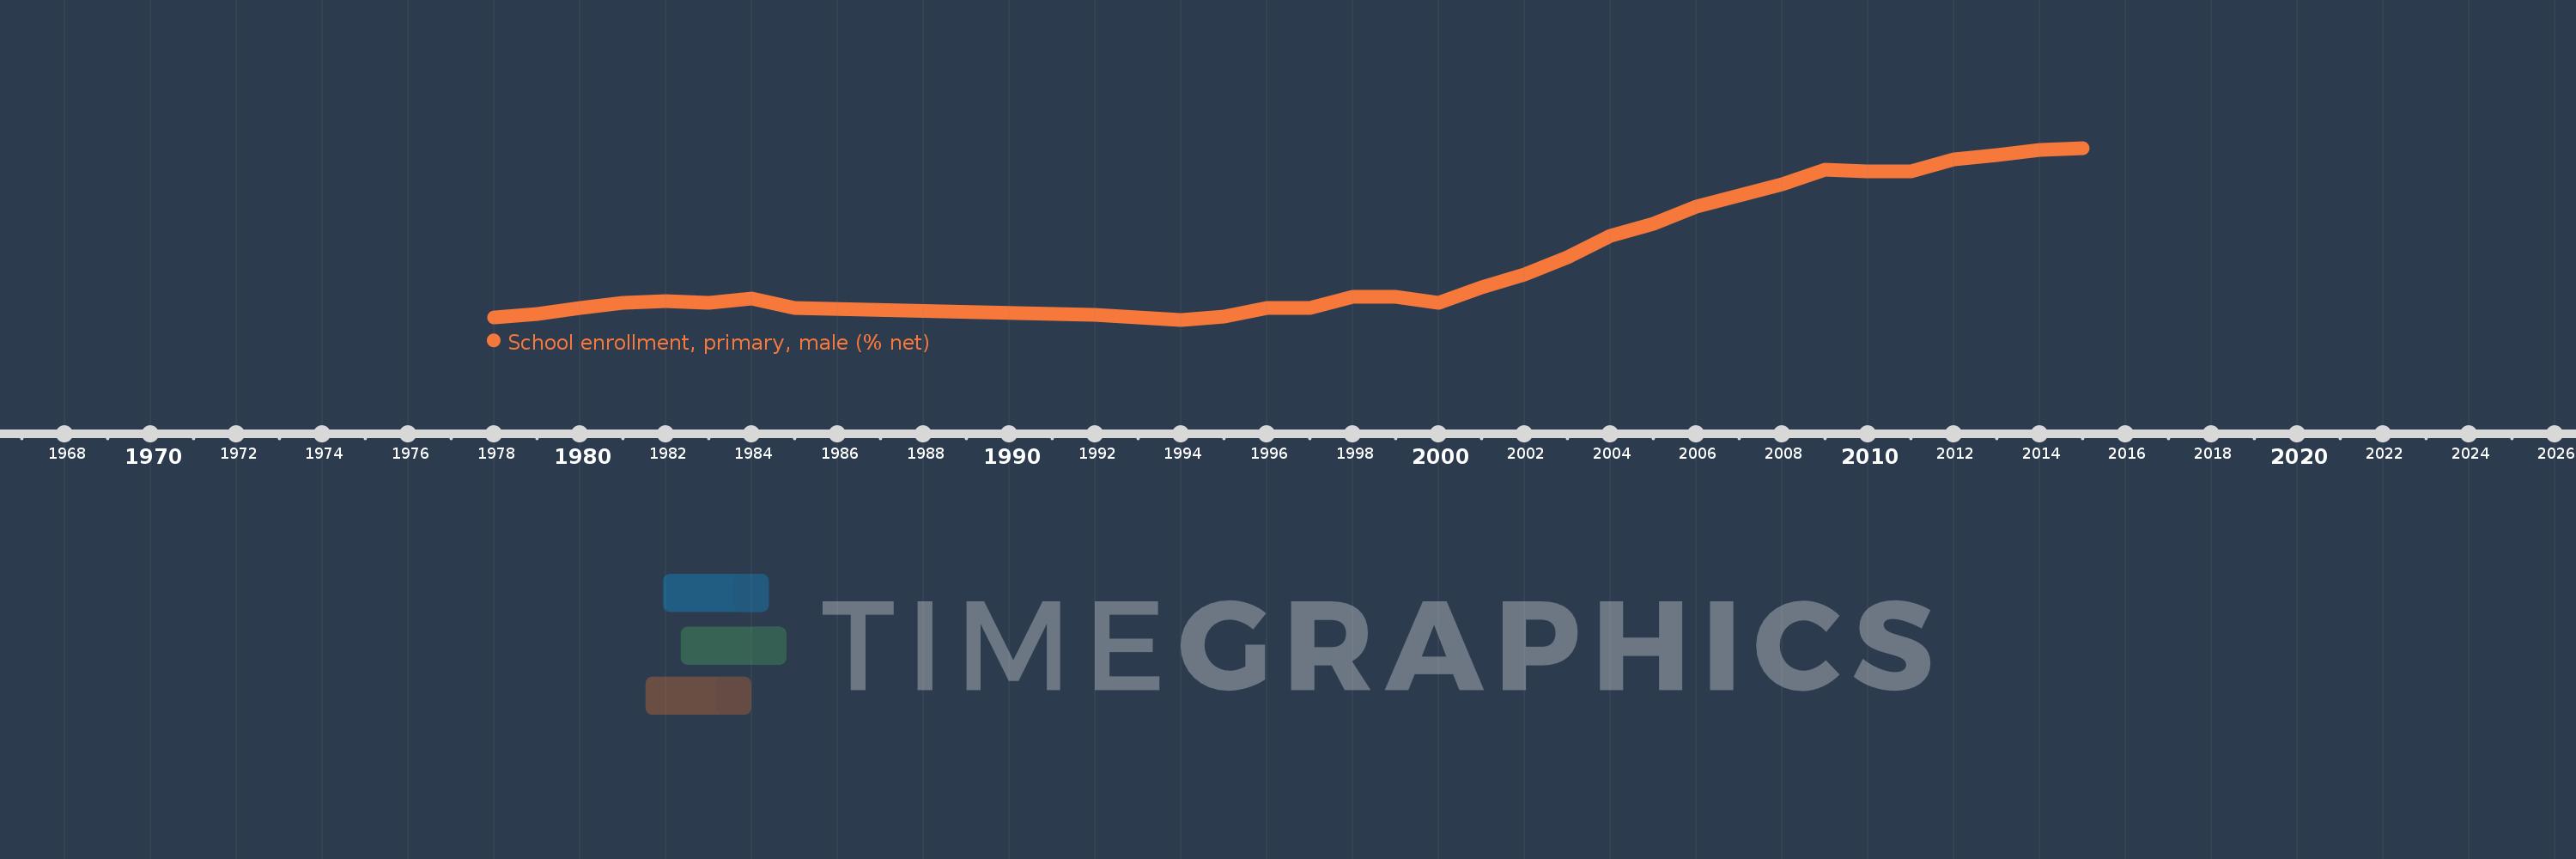
School enrollment, primary, male (% net)
2015,2014,2013,2012,2011,2010,2009,2008,2007,2006,2005,2004,2003,2002,2001,2000,1999,1998,1997,1996,1995,1994,1993,1992,1985,1984,1983,1982,1981,1980,1979,1978
This statistics in other country:
AfghanistanAlbaniaAlgeriaAngolaAntigua and BarbudaArab WorldArgentinaArmeniaArubaAustraliaAustriaAzerbaijanBahamas, TheBahrainBangladeshBarbadosBelarusBelgiumBelizeBeninBermudaBhutanBoliviaBosnia and HerzegovinaBotswanaBrazilBrunei DarussalamBulgariaBurkina FasoBurundiCabo VerdeCambodiaCameroonCanadaCaribbean small statesCentral African RepublicCentral Europe and the BalticsChadChileChinaColombiaComorosCongo, Dem. Rep.Congo, Rep.Costa RicaCote d'IvoireCroatiaCubaCyprusDenmarkDjiboutiDominicaDominican RepublicEarly-demographic dividendEast Asia & PacificEast Asia & Pacific (excluding high income)East Asia & Pacific (IDA & IBRD countries)EcuadorEgypt, Arab Rep.El SalvadorEquatorial GuineaEritreaEstoniaEthiopiaEuro areaEurope & Central AsiaEurope & Central Asia (excluding high income)Europe & Central Asia (IDA & IBRD countries)European UnionFijiFinlandFragile and conflict affected situationsFranceGabonGambia, TheGeorgiaGhanaGreeceGrenadaGuatemalaGuineaGuinea-BissauGuyanaHaitiHeavily indebted poor countries (HIPC)High incomeHondurasHong Kong SAR, ChinaHungaryIBRD onlyIcelandIDA & IBRD totalIDA blendIDA onlyIDA totalIndiaIndonesiaIran, Islamic Rep.IraqIrelandIsraelItalyJamaicaJapanJordanKazakhstanKenyaKiribatiKorea, Dem. People’s Rep.Korea, Rep.KuwaitKyrgyz RepublicLao PDRLate-demographic dividendLatin America & Caribbean Latin America & Caribbean (excluding high income)Latin America & the Caribbean (IDA & IBRD countries)LatviaLeast developed countries: UN classificationLebanonLesothoLiberiaLibyaLiechtensteinLithuaniaLow & middle incomeLow incomeLower middle incomeLuxembourgMacao SAR, ChinaMacedonia, FYRMadagascarMalawiMaldivesMaliMaltaMarshall IslandsMauritaniaMauritiusMexicoMicronesia, Fed. Sts.Middle East & North AfricaMiddle East & North Africa (excluding high income)Middle East & North Africa (IDA & IBRD countries)Middle incomeMoldovaMongoliaMontenegroMoroccoMozambiqueMyanmarNamibiaNauruNepalNetherlandsNew ZealandNicaraguaNigerNigeriaNorth AmericaNorwayOECD membersOmanOther small statesPacific island small statesPakistanPanamaPapua New GuineaParaguayPeruPhilippinesPolandPortugalPost-demographic dividendPre-demographic dividendPuerto RicoQatarRomaniaRussian FederationRwandaSamoaSan MarinoSao Tome and PrincipeSaudi ArabiaSenegalSerbiaSeychellesSierra LeoneSloveniaSmall statesSolomon IslandsSomaliaSouth AfricaSouth AsiaSouth Asia (IDA & IBRD)South SudanSpainSri LankaSt. Kitts and NevisSt. LuciaSt. Vincent and the GrenadinesSub-Saharan Africa Sub-Saharan Africa (excluding high income)Sub-Saharan Africa (IDA & IBRD countries)SudanSurinameSwazilandSwedenSwitzerlandSyrian Arab RepublicTajikistanTanzaniaThailandTimor-LesteTogoTongaTrinidad and TobagoTunisiaTurkeyTuvaluUgandaUkraineUnited Arab EmiratesUnited KingdomUnited StatesUpper middle incomeUruguayUzbekistanVanuatuVenezuela, RBWest Bank and GazaWorldYemen, Rep.ZambiaZimbabwe Timeline:
This timeline shows a graph from 1978 to 2015 of IDA only. No data until 1977. Number of actual observations by date: 32.
Source name:
World Development Indicators
Source organization:
United Nations Educational, Scientific, and Cultural Organization (UNESCO) Institute for Statistics.
Categories, topics:
Education, Gender
Last updated:
apr 23, 2017
Indicators value changes by year
Minimum:
59.872
jan 1, 1994
Maximum:
83.322
jan 1, 2015
At the date of observation
Value
Absolute change
Change from previous value
jan 1, 1978
60.188
+60.188
0.0%
jan 1, 1979
60.642
+0.454
0.75%
jan 1, 1980
61.528
+0.886
1.46%
jan 1, 1981
62.188
+0.66
1.07%
jan 1, 1982
62.417
+0.229
0.37%
jan 1, 1983
62.206
-0.211
-0.34%
jan 1, 1984
62.744
+0.537
0.86%
jan 1, 1985
61.464
-1.279
-2.04%
jan 1, 1992
60.528
-0.936
-1.52%
jan 1, 1993
60.141
-0.387
-0.64%
jan 1, 1994
59.872
-0.269
-0.45%
jan 1, 1995
60.315
+0.443
0.74%
jan 1, 1996
61.439
+1.124
1.86%
jan 1, 1997
61.524
+0.085
0.14%
jan 1, 1998
62.954
+1.43
2.32%
jan 1, 1999
62.953
-0.001
0.0%
jan 1, 2000
62.195
-0.758
-1.2%
jan 1, 2001
64.234
+2.039
3.28%
jan 1, 2002
66.046
+1.812
2.82%
jan 1, 2003
68.409
+2.363
3.58%
jan 1, 2004
71.28
+2.871
4.2%
jan 1, 2005
72.966
+1.686
2.37%
jan 1, 2006
75.265
+2.299
3.15%
jan 1, 2007
76.853
+1.589
2.11%
jan 1, 2008
78.388
+1.535
2.0%
jan 1, 2009
80.386
+1.998
2.55%
jan 1, 2010
80.124
-0.262
-0.33%
jan 1, 2011
80.156
+0.032
0.04%
jan 1, 2012
81.711
+1.555
1.94%
jan 1, 2013
82.309
+0.598
0.73%
jan 1, 2014
83.051
+0.741
0.9%
jan 1, 2015
83.322
+0.272
0.33%
Ranking of countries by current statistics by years


Comments: