29
/
en
AIzaSyAYiBZKx7MnpbEhh9jyipgxe19OcubqV5w
April 1, 2024
214772
Norway
NOR
true
2
1
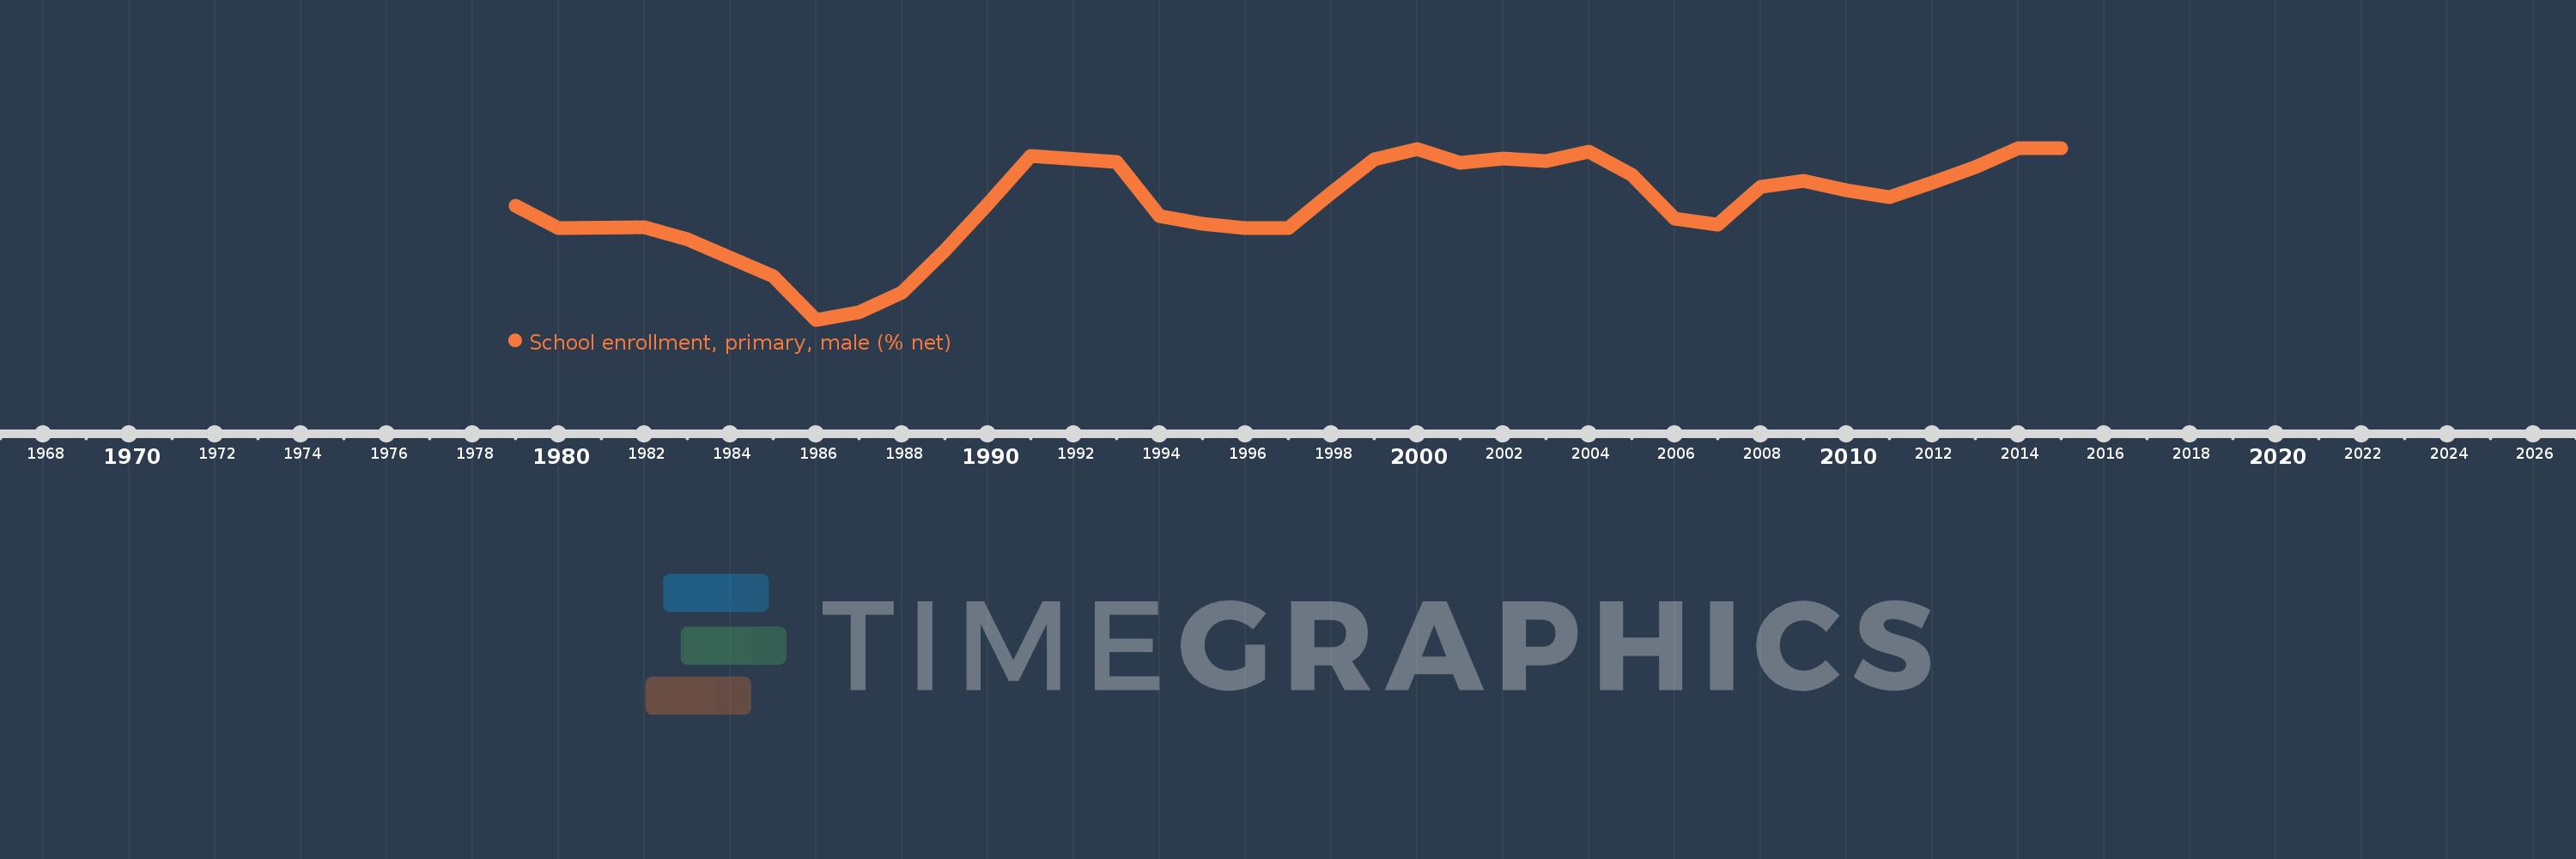
School enrollment, primary, male (% net)
2015,2014,2013,2012,2011,2010,2009,2008,2007,2006,2005,2004,2003,2002,2001,2000,1999,1998,1997,1996,1995,1994,1993,1991,1990,1989,1988,1987,1986,1985,1983,1982,1980,1979
This statistics in other country:
AfghanistanAlbaniaAlgeriaAngolaAntigua and BarbudaArab WorldArgentinaArmeniaArubaAustraliaAustriaAzerbaijanBahamas, TheBahrainBangladeshBarbadosBelarusBelgiumBelizeBeninBermudaBhutanBoliviaBosnia and HerzegovinaBotswanaBrazilBrunei DarussalamBulgariaBurkina FasoBurundiCabo VerdeCambodiaCameroonCanadaCaribbean small statesCentral African RepublicCentral Europe and the BalticsChadChileChinaColombiaComorosCongo, Dem. Rep.Congo, Rep.Costa RicaCote d'IvoireCroatiaCubaCyprusDenmarkDjiboutiDominicaDominican RepublicEarly-demographic dividendEast Asia & PacificEast Asia & Pacific (excluding high income)East Asia & Pacific (IDA & IBRD countries)EcuadorEgypt, Arab Rep.El SalvadorEquatorial GuineaEritreaEstoniaEthiopiaEuro areaEurope & Central AsiaEurope & Central Asia (excluding high income)Europe & Central Asia (IDA & IBRD countries)European UnionFijiFinlandFragile and conflict affected situationsFranceGabonGambia, TheGeorgiaGhanaGreeceGrenadaGuatemalaGuineaGuinea-BissauGuyanaHaitiHeavily indebted poor countries (HIPC)High incomeHondurasHong Kong SAR, ChinaHungaryIBRD onlyIcelandIDA & IBRD totalIDA blendIDA onlyIDA totalIndiaIndonesiaIran, Islamic Rep.IraqIrelandIsraelItalyJamaicaJapanJordanKazakhstanKenyaKiribatiKorea, Dem. People’s Rep.Korea, Rep.KuwaitKyrgyz RepublicLao PDRLate-demographic dividendLatin America & Caribbean Latin America & Caribbean (excluding high income)Latin America & the Caribbean (IDA & IBRD countries)LatviaLeast developed countries: UN classificationLebanonLesothoLiberiaLibyaLiechtensteinLithuaniaLow & middle incomeLow incomeLower middle incomeLuxembourgMacao SAR, ChinaMacedonia, FYRMadagascarMalawiMaldivesMaliMaltaMarshall IslandsMauritaniaMauritiusMexicoMicronesia, Fed. Sts.Middle East & North AfricaMiddle East & North Africa (excluding high income)Middle East & North Africa (IDA & IBRD countries)Middle incomeMoldovaMongoliaMontenegroMoroccoMozambiqueMyanmarNamibiaNauruNepalNetherlandsNew ZealandNicaraguaNigerNigeriaNorth AmericaNorwayOECD membersOmanOther small statesPacific island small statesPakistanPanamaPapua New GuineaParaguayPeruPhilippinesPolandPortugalPost-demographic dividendPre-demographic dividendPuerto RicoQatarRomaniaRussian FederationRwandaSamoaSan MarinoSao Tome and PrincipeSaudi ArabiaSenegalSerbiaSeychellesSierra LeoneSloveniaSmall statesSolomon IslandsSomaliaSouth AfricaSouth AsiaSouth Asia (IDA & IBRD)South SudanSpainSri LankaSt. Kitts and NevisSt. LuciaSt. Vincent and the GrenadinesSub-Saharan Africa Sub-Saharan Africa (excluding high income)Sub-Saharan Africa (IDA & IBRD countries)SudanSurinameSwazilandSwedenSwitzerlandSyrian Arab RepublicTajikistanTanzaniaThailandTimor-LesteTogoTongaTrinidad and TobagoTunisiaTurkeyTuvaluUgandaUkraineUnited Arab EmiratesUnited KingdomUnited StatesUpper middle incomeUruguayUzbekistanVanuatuVenezuela, RBWest Bank and GazaWorldYemen, Rep.ZambiaZimbabwe Timeline:
This timeline shows a graph from 1979 to 2015 of Norway. No data until 1978. Number of actual observations by date: 34.
Source name:
World Development Indicators
Source organization:
United Nations Educational, Scientific, and Cultural Organization (UNESCO) Institute for Statistics.
Categories, topics:
Education, Gender
Last updated:
apr 23, 2017
Indicators value changes by year
Minimum:
96.363
jan 1, 1986
Maximum:
99.909
jan 1, 2015
At the date of observation
Value
Absolute change
Change from previous value
jan 1, 1979
98.721
+98.721
0.0%
jan 1, 1980
98.262
-0.459
-0.47%
jan 1, 1982
98.271
+0.01
0.01%
jan 1, 1983
98.022
-0.249
-0.25%
jan 1, 1985
97.27
-0.752
-0.77%
jan 1, 1986
96.363
-0.908
-0.93%
jan 1, 1987
96.51
+0.147
0.15%
jan 1, 1988
96.92
+0.41
0.42%
jan 1, 1989
97.794
+0.874
0.9%
jan 1, 1990
98.75
+0.957
0.98%
jan 1, 1991
99.742
+0.992
1.0%
jan 1, 1993
99.615
-0.127
-0.13%
jan 1, 1994
98.505
-1.11
-1.11%
jan 1, 1995
98.338
-0.167
-0.17%
jan 1, 1996
98.246
-0.093
-0.09%
jan 1, 1997
98.258
+0.013
0.01%
jan 1, 1998
98.986
+0.728
0.74%
jan 1, 1999
99.678
+0.691
0.7%
jan 1, 2000
99.88
+0.203
0.2%
jan 1, 2001
99.607
-0.273
-0.27%
jan 1, 2002
99.696
+0.088
0.09%
jan 1, 2003
99.629
-0.067
-0.07%
jan 1, 2004
99.833
+0.205
0.21%
jan 1, 2005
99.356
-0.477
-0.48%
jan 1, 2006
98.443
-0.913
-0.92%
jan 1, 2007
98.323
-0.12
-0.12%
jan 1, 2008
99.113
+0.789
0.8%
jan 1, 2009
99.235
+0.123
0.12%
jan 1, 2010
99.042
-0.193
-0.19%
jan 1, 2011
98.899
-0.143
-0.14%
jan 1, 2012
99.199
+0.3
0.3%
jan 1, 2013
99.51
+0.311
0.31%
jan 1, 2014
99.908
+0.397
0.4%
jan 1, 2015
99.909
+0.002
0.0%
Ranking of countries by current statistics by years


Comments: