29
/
en
AIzaSyAYiBZKx7MnpbEhh9jyipgxe19OcubqV5w
April 1, 2024
37775
IDA & IBRD total
IBT
false
2
1
School enrollment, primary, male (% net)
2015,2014,2013,2012,2011,2010,2009,2008,2007,2006,2005,2004,2003,2002,2001,2000,1999,1998,1997,1996,1995,1994,1993,1992,1988,1987,1986,1982
This statistics in other country:
AfghanistanAlbaniaAlgeriaAngolaAntigua and BarbudaArab WorldArgentinaArmeniaArubaAustraliaAustriaAzerbaijanBahamas, TheBahrainBangladeshBarbadosBelarusBelgiumBelizeBeninBermudaBhutanBoliviaBosnia and HerzegovinaBotswanaBrazilBrunei DarussalamBulgariaBurkina FasoBurundiCabo VerdeCambodiaCameroonCanadaCaribbean small statesCentral African RepublicCentral Europe and the BalticsChadChileChinaColombiaComorosCongo, Dem. Rep.Congo, Rep.Costa RicaCote d'IvoireCroatiaCubaCyprusDenmarkDjiboutiDominicaDominican RepublicEarly-demographic dividendEast Asia & PacificEast Asia & Pacific (excluding high income)East Asia & Pacific (IDA & IBRD countries)EcuadorEgypt, Arab Rep.El SalvadorEquatorial GuineaEritreaEstoniaEthiopiaEuro areaEurope & Central AsiaEurope & Central Asia (excluding high income)Europe & Central Asia (IDA & IBRD countries)European UnionFijiFinlandFragile and conflict affected situationsFranceGabonGambia, TheGeorgiaGhanaGreeceGrenadaGuatemalaGuineaGuinea-BissauGuyanaHaitiHeavily indebted poor countries (HIPC)High incomeHondurasHong Kong SAR, ChinaHungaryIBRD onlyIcelandIDA & IBRD totalIDA blendIDA onlyIDA totalIndiaIndonesiaIran, Islamic Rep.IraqIrelandIsraelItalyJamaicaJapanJordanKazakhstanKenyaKiribatiKorea, Dem. People’s Rep.Korea, Rep.KuwaitKyrgyz RepublicLao PDRLate-demographic dividendLatin America & Caribbean Latin America & Caribbean (excluding high income)Latin America & the Caribbean (IDA & IBRD countries)LatviaLeast developed countries: UN classificationLebanonLesothoLiberiaLibyaLiechtensteinLithuaniaLow & middle incomeLow incomeLower middle incomeLuxembourgMacao SAR, ChinaMacedonia, FYRMadagascarMalawiMaldivesMaliMaltaMarshall IslandsMauritaniaMauritiusMexicoMicronesia, Fed. Sts.Middle East & North AfricaMiddle East & North Africa (excluding high income)Middle East & North Africa (IDA & IBRD countries)Middle incomeMoldovaMongoliaMontenegroMoroccoMozambiqueMyanmarNamibiaNauruNepalNetherlandsNew ZealandNicaraguaNigerNigeriaNorth AmericaNorwayOECD membersOmanOther small statesPacific island small statesPakistanPanamaPapua New GuineaParaguayPeruPhilippinesPolandPortugalPost-demographic dividendPre-demographic dividendPuerto RicoQatarRomaniaRussian FederationRwandaSamoaSan MarinoSao Tome and PrincipeSaudi ArabiaSenegalSerbiaSeychellesSierra LeoneSloveniaSmall statesSolomon IslandsSomaliaSouth AfricaSouth AsiaSouth Asia (IDA & IBRD)South SudanSpainSri LankaSt. Kitts and NevisSt. LuciaSt. Vincent and the GrenadinesSub-Saharan Africa Sub-Saharan Africa (excluding high income)Sub-Saharan Africa (IDA & IBRD countries)SudanSurinameSwazilandSwedenSwitzerlandSyrian Arab RepublicTajikistanTanzaniaThailandTimor-LesteTogoTongaTrinidad and TobagoTunisiaTurkeyTuvaluUgandaUkraineUnited Arab EmiratesUnited KingdomUnited StatesUpper middle incomeUruguayUzbekistanVanuatuVenezuela, RBWest Bank and GazaWorldYemen, Rep.ZambiaZimbabwe Timeline:
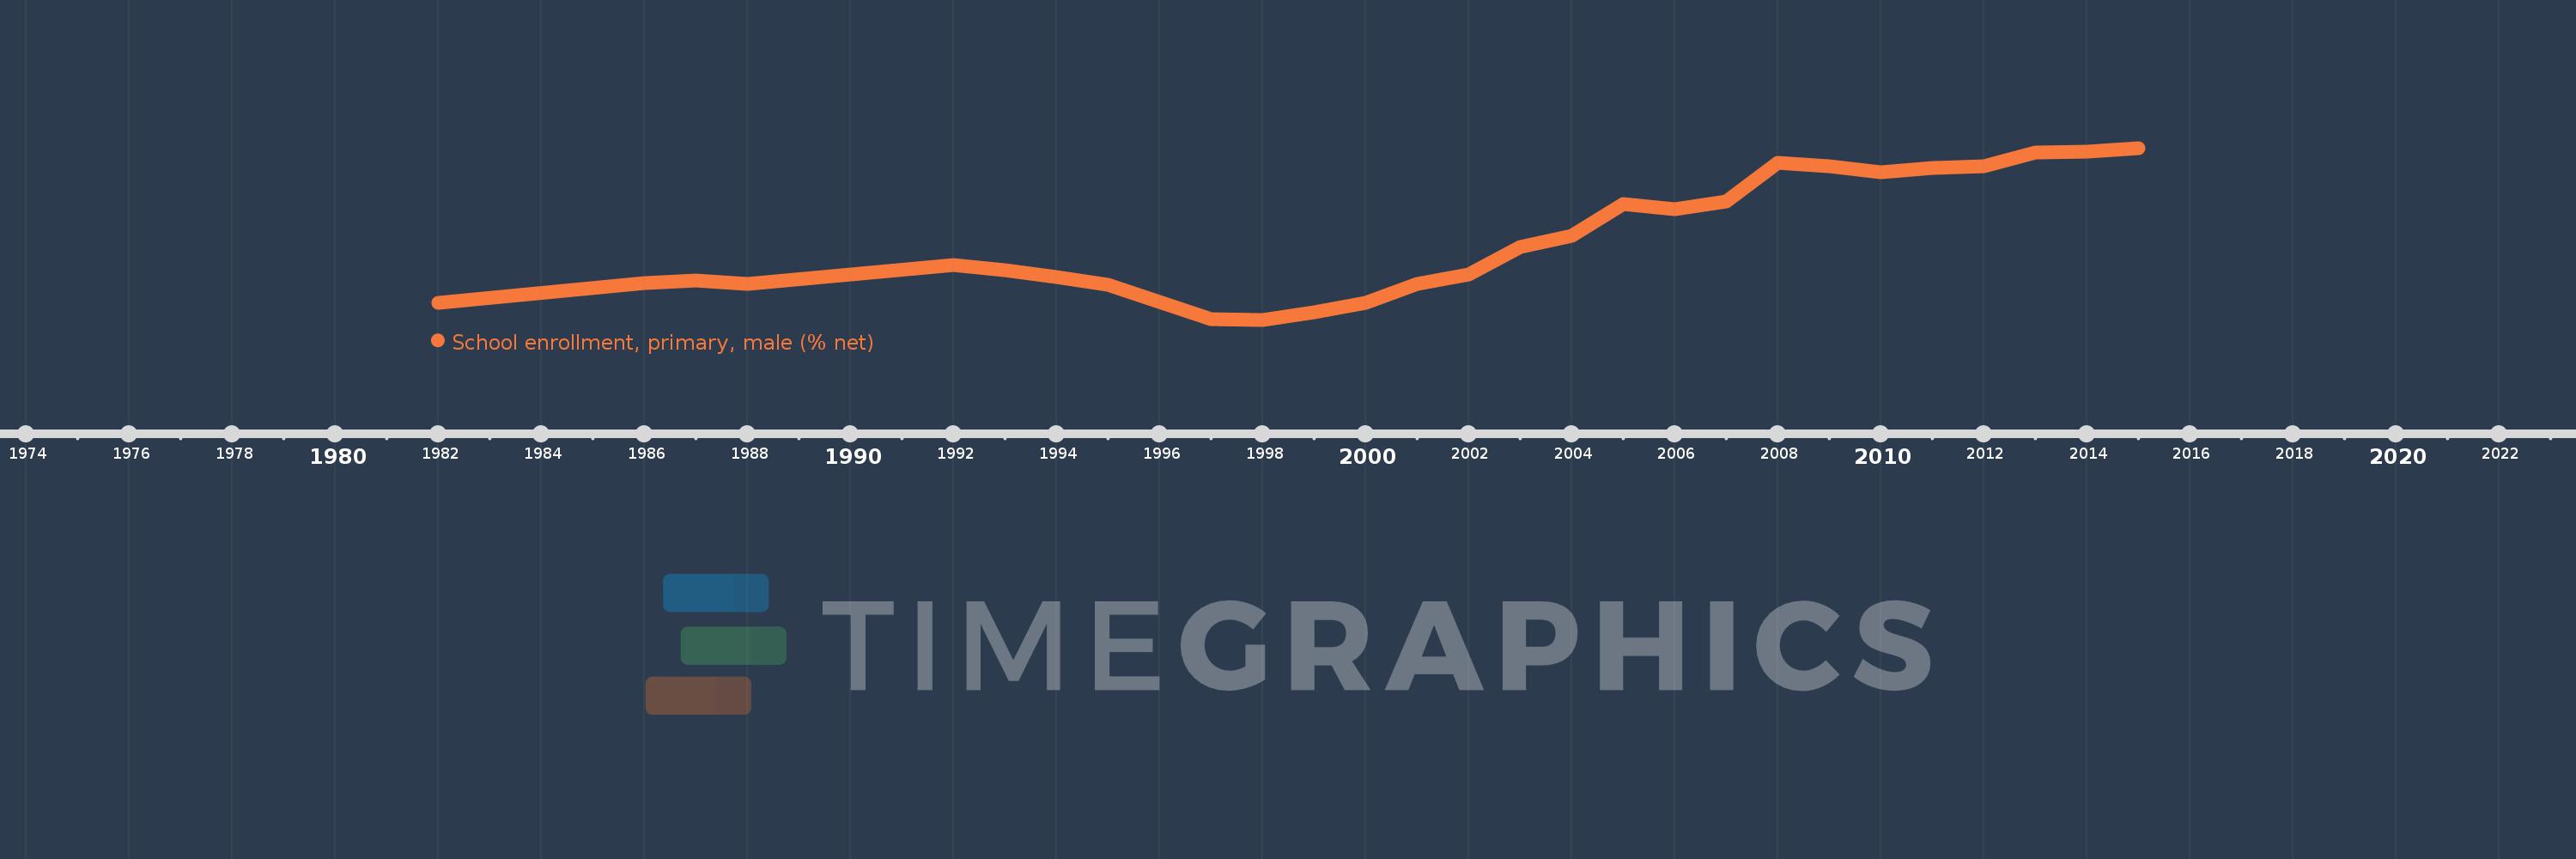
This timeline shows a graph from 1982 to 2015 of IDA & IBRD total. No data until 1981. Number of actual observations by date: 28.
Source name:
World Development Indicators
Source organization:
United Nations Educational, Scientific, and Cultural Organization (UNESCO) Institute for Statistics.
Categories, topics:
Education, Gender
Last updated:
apr 23, 2017
Indicators value changes by year
Minimum:
83.687
jan 1, 1998
Maximum:
89.411
jan 1, 2015
At the date of observation
Value
Absolute change
Change from previous value
jan 1, 1982
84.259
+84.259
0.0%
jan 1, 1986
84.895
+0.636
0.76%
jan 1, 1987
84.985
+0.091
0.11%
jan 1, 1988
84.882
-0.104
-0.12%
jan 1, 1992
85.523
+0.641
0.76%
jan 1, 1993
85.325
-0.197
-0.23%
jan 1, 1994
85.097
-0.228
-0.27%
jan 1, 1995
84.854
-0.243
-0.29%
jan 1, 1996
84.28
-0.574
-0.68%
jan 1, 1997
83.7
-0.58
-0.69%
jan 1, 1998
83.687
-0.013
-0.02%
jan 1, 1999
83.936
+0.249
0.3%
jan 1, 2000
84.252
+0.315
0.38%
jan 1, 2001
84.878
+0.626
0.74%
jan 1, 2002
85.205
+0.327
0.39%
jan 1, 2003
86.123
+0.917
1.08%
jan 1, 2004
86.483
+0.36
0.42%
jan 1, 2005
87.556
+1.073
1.24%
jan 1, 2006
87.365
-0.191
-0.22%
jan 1, 2007
87.64
+0.275
0.31%
jan 1, 2008
88.915
+1.275
1.46%
jan 1, 2009
88.801
-0.114
-0.13%
jan 1, 2010
88.598
-0.203
-0.23%
jan 1, 2011
88.756
+0.159
0.18%
jan 1, 2012
88.793
+0.037
0.04%
jan 1, 2013
89.263
+0.469
0.53%
jan 1, 2014
89.286
+0.023
0.03%
jan 1, 2015
89.411
+0.125
0.14%
Ranking of countries by current statistics by years


Comments: