29
/
en
AIzaSyAYiBZKx7MnpbEhh9jyipgxe19OcubqV5w
April 1, 2024
43861
Latin America & the Caribbean (IDA & IBRD countries)
TLA
false
2
1
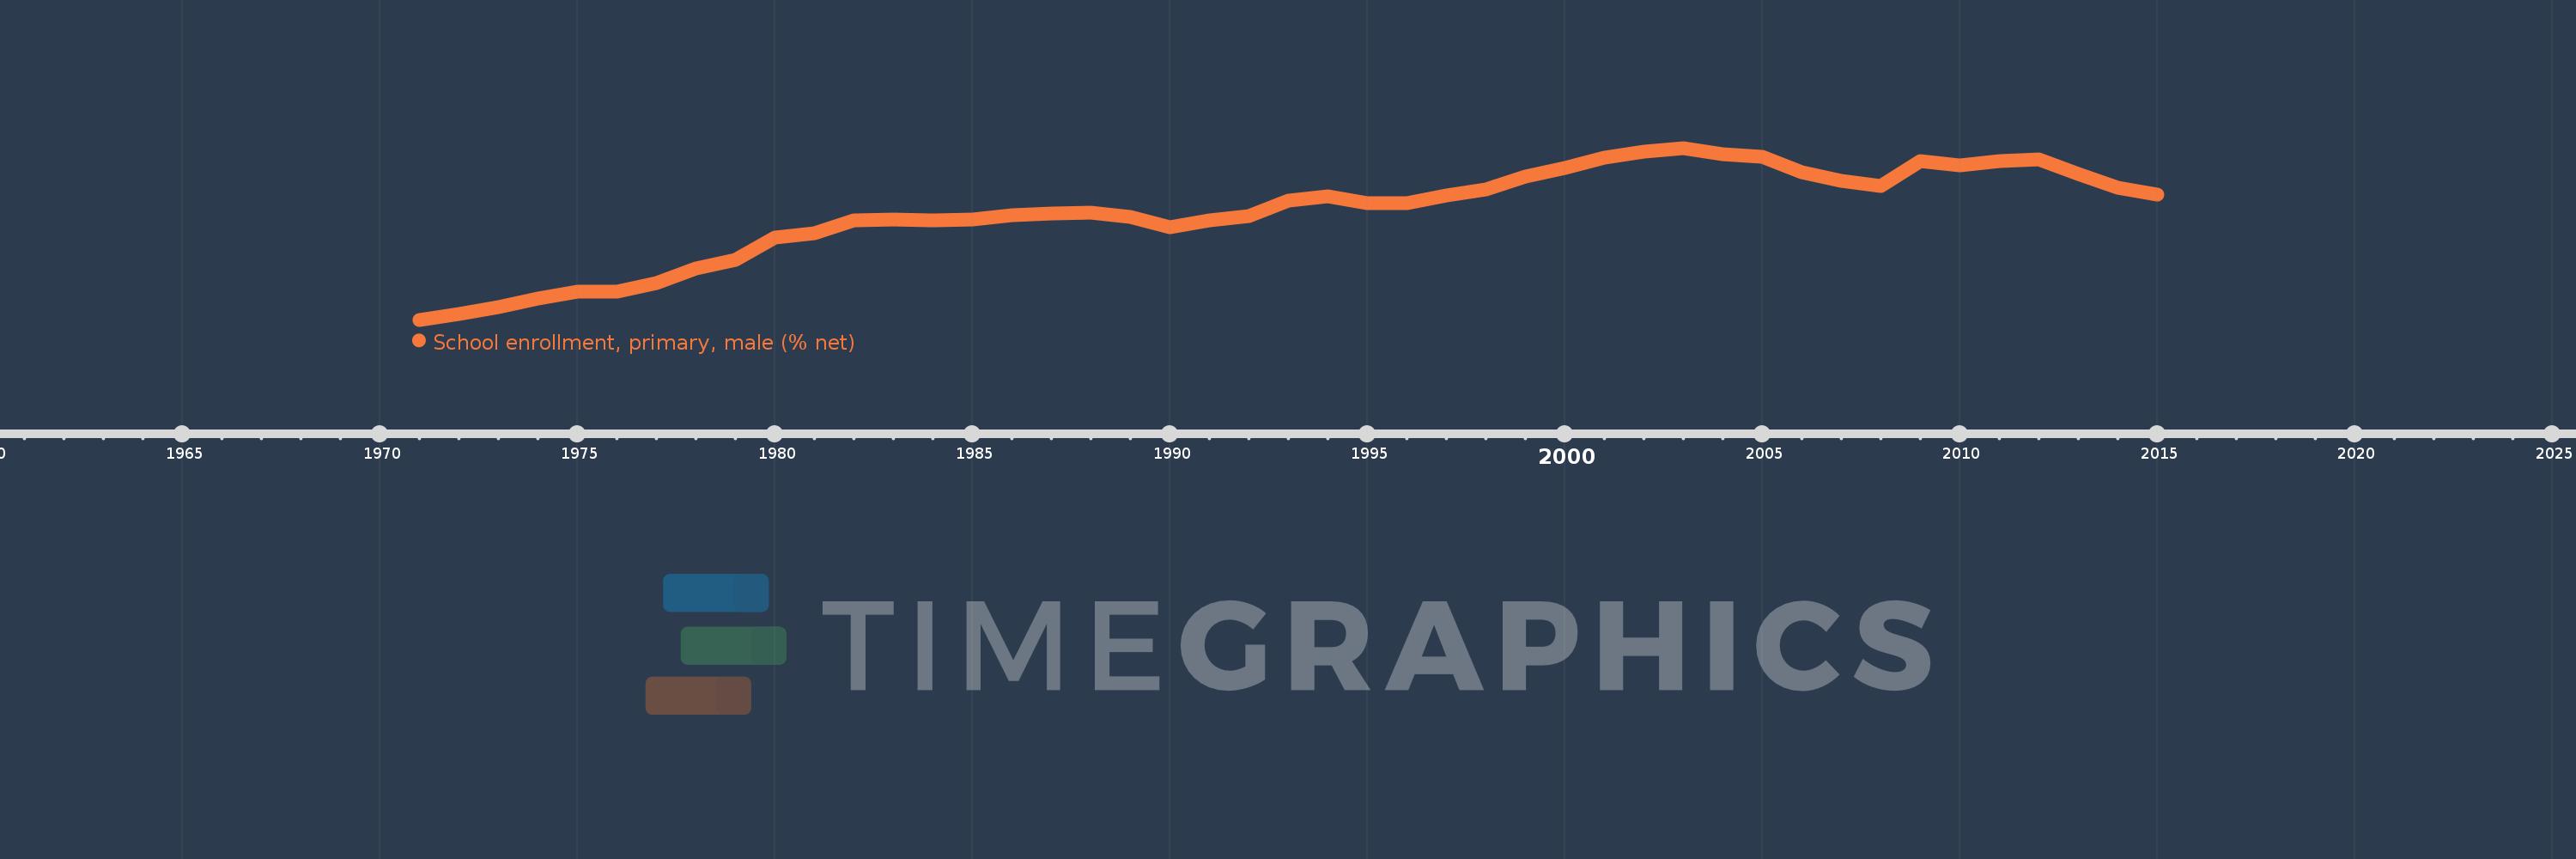
School enrollment, primary, male (% net)
2015,2014,2013,2012,2011,2010,2009,2008,2007,2006,2005,2004,2003,2002,2001,2000,1999,1998,1997,1996,1995,1994,1993,1992,1991,1990,1989,1988,1987,1986,1985,1984,1983,1982,1981,1980,1979,1978,1977,1976,1975,1974,1973,1972,1971
This statistics in other country:
AfghanistanAlbaniaAlgeriaAngolaAntigua and BarbudaArab WorldArgentinaArmeniaArubaAustraliaAustriaAzerbaijanBahamas, TheBahrainBangladeshBarbadosBelarusBelgiumBelizeBeninBermudaBhutanBoliviaBosnia and HerzegovinaBotswanaBrazilBrunei DarussalamBulgariaBurkina FasoBurundiCabo VerdeCambodiaCameroonCanadaCaribbean small statesCentral African RepublicCentral Europe and the BalticsChadChileChinaColombiaComorosCongo, Dem. Rep.Congo, Rep.Costa RicaCote d'IvoireCroatiaCubaCyprusDenmarkDjiboutiDominicaDominican RepublicEarly-demographic dividendEast Asia & PacificEast Asia & Pacific (excluding high income)East Asia & Pacific (IDA & IBRD countries)EcuadorEgypt, Arab Rep.El SalvadorEquatorial GuineaEritreaEstoniaEthiopiaEuro areaEurope & Central AsiaEurope & Central Asia (excluding high income)Europe & Central Asia (IDA & IBRD countries)European UnionFijiFinlandFragile and conflict affected situationsFranceGabonGambia, TheGeorgiaGhanaGreeceGrenadaGuatemalaGuineaGuinea-BissauGuyanaHaitiHeavily indebted poor countries (HIPC)High incomeHondurasHong Kong SAR, ChinaHungaryIBRD onlyIcelandIDA & IBRD totalIDA blendIDA onlyIDA totalIndiaIndonesiaIran, Islamic Rep.IraqIrelandIsraelItalyJamaicaJapanJordanKazakhstanKenyaKiribatiKorea, Dem. People’s Rep.Korea, Rep.KuwaitKyrgyz RepublicLao PDRLate-demographic dividendLatin America & Caribbean Latin America & Caribbean (excluding high income)Latin America & the Caribbean (IDA & IBRD countries)LatviaLeast developed countries: UN classificationLebanonLesothoLiberiaLibyaLiechtensteinLithuaniaLow & middle incomeLow incomeLower middle incomeLuxembourgMacao SAR, ChinaMacedonia, FYRMadagascarMalawiMaldivesMaliMaltaMarshall IslandsMauritaniaMauritiusMexicoMicronesia, Fed. Sts.Middle East & North AfricaMiddle East & North Africa (excluding high income)Middle East & North Africa (IDA & IBRD countries)Middle incomeMoldovaMongoliaMontenegroMoroccoMozambiqueMyanmarNamibiaNauruNepalNetherlandsNew ZealandNicaraguaNigerNigeriaNorth AmericaNorwayOECD membersOmanOther small statesPacific island small statesPakistanPanamaPapua New GuineaParaguayPeruPhilippinesPolandPortugalPost-demographic dividendPre-demographic dividendPuerto RicoQatarRomaniaRussian FederationRwandaSamoaSan MarinoSao Tome and PrincipeSaudi ArabiaSenegalSerbiaSeychellesSierra LeoneSloveniaSmall statesSolomon IslandsSomaliaSouth AfricaSouth AsiaSouth Asia (IDA & IBRD)South SudanSpainSri LankaSt. Kitts and NevisSt. LuciaSt. Vincent and the GrenadinesSub-Saharan Africa Sub-Saharan Africa (excluding high income)Sub-Saharan Africa (IDA & IBRD countries)SudanSurinameSwazilandSwedenSwitzerlandSyrian Arab RepublicTajikistanTanzaniaThailandTimor-LesteTogoTongaTrinidad and TobagoTunisiaTurkeyTuvaluUgandaUkraineUnited Arab EmiratesUnited KingdomUnited StatesUpper middle incomeUruguayUzbekistanVanuatuVenezuela, RBWest Bank and GazaWorldYemen, Rep.ZambiaZimbabwe Timeline:
This timeline shows a graph from 1971 to 2015 of Latin America & the Caribbean (IDA & IBRD countries). No data until 1970. Number of actual observations by date: 45.
Source name:
World Development Indicators
Source organization:
United Nations Educational, Scientific, and Cultural Organization (UNESCO) Institute for Statistics.
Categories, topics:
Education, Gender
Last updated:
apr 23, 2017
Indicators value changes by year
Minimum:
83.047
jan 1, 1971
Maximum:
95.046
jan 1, 2003
At the date of observation
Value
Absolute change
Change from previous value
jan 1, 1971
83.047
+83.047
0.0%
jan 1, 1972
83.469
+0.422
0.51%
jan 1, 1973
83.935
+0.466
0.56%
jan 1, 1974
84.516
+0.581
0.69%
jan 1, 1975
85.022
+0.506
0.6%
jan 1, 1976
85.017
-0.005
-0.01%
jan 1, 1977
85.602
+0.585
0.69%
jan 1, 1978
86.639
+1.037
1.21%
jan 1, 1979
87.203
+0.564
0.65%
jan 1, 1980
88.812
+1.609
1.84%
jan 1, 1981
89.099
+0.287
0.32%
jan 1, 1982
90.005
+0.906
1.02%
jan 1, 1983
90.022
+0.017
0.02%
jan 1, 1984
89.984
-0.039
-0.04%
jan 1, 1985
90.043
+0.059
0.07%
jan 1, 1986
90.358
+0.315
0.35%
jan 1, 1987
90.445
+0.087
0.1%
jan 1, 1988
90.509
+0.064
0.07%
jan 1, 1989
90.257
-0.252
-0.28%
jan 1, 1990
89.507
-0.75
-0.83%
jan 1, 1991
89.992
+0.485
0.54%
jan 1, 1992
90.316
+0.324
0.36%
jan 1, 1993
91.361
+1.045
1.16%
jan 1, 1994
91.648
+0.287
0.31%
jan 1, 1995
91.17
-0.478
-0.52%
jan 1, 1996
91.174
+0.005
0.01%
jan 1, 1997
91.74
+0.566
0.62%
jan 1, 1998
92.126
+0.386
0.42%
jan 1, 1999
93.056
+0.93
1.01%
jan 1, 2000
93.648
+0.593
0.64%
jan 1, 2001
94.381
+0.732
0.78%
jan 1, 2002
94.788
+0.408
0.43%
jan 1, 2003
95.046
+0.258
0.27%
jan 1, 2004
94.63
-0.416
-0.44%
jan 1, 2005
94.403
-0.228
-0.24%
jan 1, 2006
93.367
-1.036
-1.1%
jan 1, 2007
92.763
-0.603
-0.65%
jan 1, 2008
92.382
-0.381
-0.41%
jan 1, 2009
94.133
+1.75
1.89%
jan 1, 2010
93.852
-0.281
-0.3%
jan 1, 2011
94.111
+0.26
0.28%
jan 1, 2012
94.258
+0.147
0.16%
jan 1, 2013
93.239
-1.019
-1.08%
jan 1, 2014
92.262
-0.977
-1.05%
jan 1, 2015
91.771
-0.491
-0.53%
Ranking of countries by current statistics by years


Comments: