29
/
en
AIzaSyAYiBZKx7MnpbEhh9jyipgxe19OcubqV5w
April 1, 2024
36985
IBRD only
IBD
false
2
1
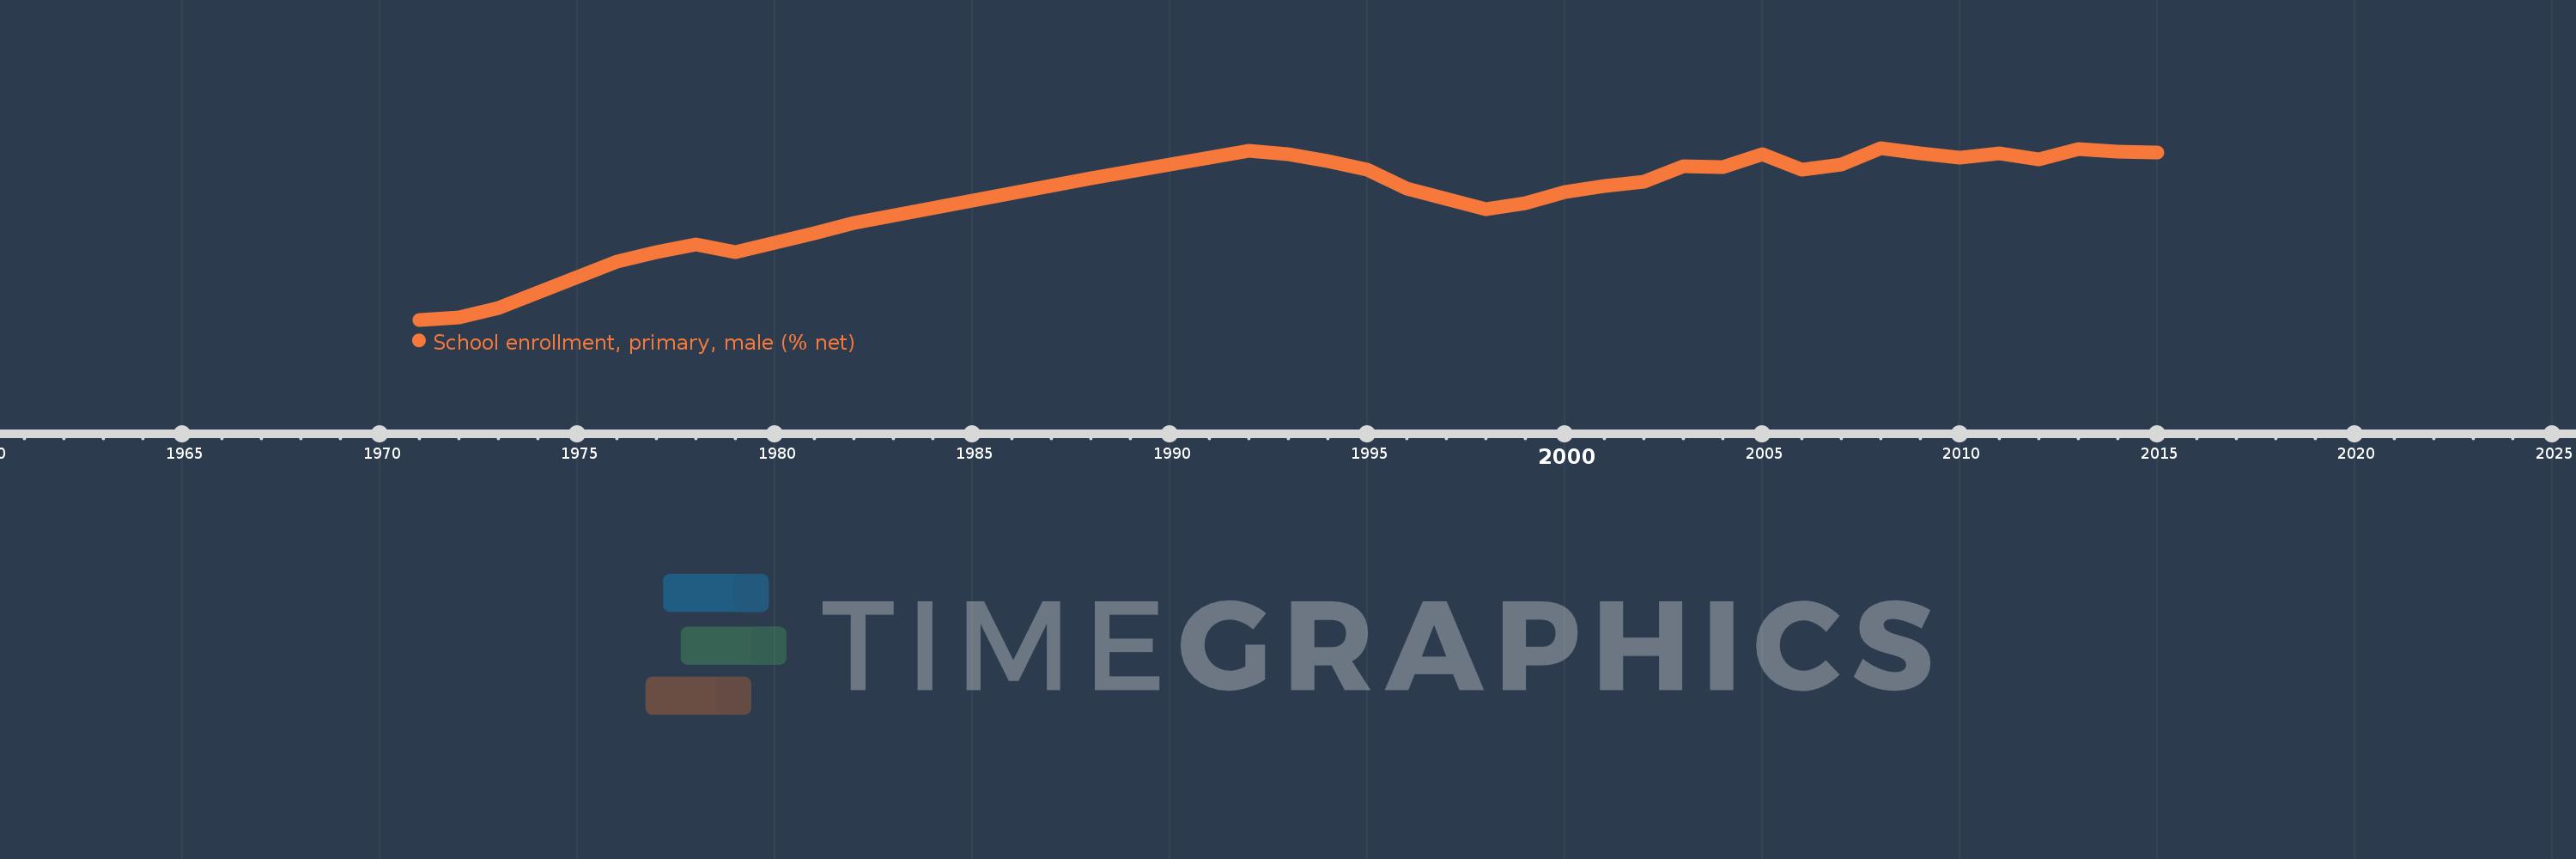
School enrollment, primary, male (% net)
2015,2014,2013,2012,2011,2010,2009,2008,2007,2006,2005,2004,2003,2002,2001,2000,1999,1998,1997,1996,1995,1994,1993,1992,1988,1982,1981,1980,1979,1978,1977,1976,1973,1972,1971
This statistics in other country:
AfghanistanAlbaniaAlgeriaAngolaAntigua and BarbudaArab WorldArgentinaArmeniaArubaAustraliaAustriaAzerbaijanBahamas, TheBahrainBangladeshBarbadosBelarusBelgiumBelizeBeninBermudaBhutanBoliviaBosnia and HerzegovinaBotswanaBrazilBrunei DarussalamBulgariaBurkina FasoBurundiCabo VerdeCambodiaCameroonCanadaCaribbean small statesCentral African RepublicCentral Europe and the BalticsChadChileChinaColombiaComorosCongo, Dem. Rep.Congo, Rep.Costa RicaCote d'IvoireCroatiaCubaCyprusDenmarkDjiboutiDominicaDominican RepublicEarly-demographic dividendEast Asia & PacificEast Asia & Pacific (excluding high income)East Asia & Pacific (IDA & IBRD countries)EcuadorEgypt, Arab Rep.El SalvadorEquatorial GuineaEritreaEstoniaEthiopiaEuro areaEurope & Central AsiaEurope & Central Asia (excluding high income)Europe & Central Asia (IDA & IBRD countries)European UnionFijiFinlandFragile and conflict affected situationsFranceGabonGambia, TheGeorgiaGhanaGreeceGrenadaGuatemalaGuineaGuinea-BissauGuyanaHaitiHeavily indebted poor countries (HIPC)High incomeHondurasHong Kong SAR, ChinaHungaryIBRD onlyIcelandIDA & IBRD totalIDA blendIDA onlyIDA totalIndiaIndonesiaIran, Islamic Rep.IraqIrelandIsraelItalyJamaicaJapanJordanKazakhstanKenyaKiribatiKorea, Dem. People’s Rep.Korea, Rep.KuwaitKyrgyz RepublicLao PDRLate-demographic dividendLatin America & Caribbean Latin America & Caribbean (excluding high income)Latin America & the Caribbean (IDA & IBRD countries)LatviaLeast developed countries: UN classificationLebanonLesothoLiberiaLibyaLiechtensteinLithuaniaLow & middle incomeLow incomeLower middle incomeLuxembourgMacao SAR, ChinaMacedonia, FYRMadagascarMalawiMaldivesMaliMaltaMarshall IslandsMauritaniaMauritiusMexicoMicronesia, Fed. Sts.Middle East & North AfricaMiddle East & North Africa (excluding high income)Middle East & North Africa (IDA & IBRD countries)Middle incomeMoldovaMongoliaMontenegroMoroccoMozambiqueMyanmarNamibiaNauruNepalNetherlandsNew ZealandNicaraguaNigerNigeriaNorth AmericaNorwayOECD membersOmanOther small statesPacific island small statesPakistanPanamaPapua New GuineaParaguayPeruPhilippinesPolandPortugalPost-demographic dividendPre-demographic dividendPuerto RicoQatarRomaniaRussian FederationRwandaSamoaSan MarinoSao Tome and PrincipeSaudi ArabiaSenegalSerbiaSeychellesSierra LeoneSloveniaSmall statesSolomon IslandsSomaliaSouth AfricaSouth AsiaSouth Asia (IDA & IBRD)South SudanSpainSri LankaSt. Kitts and NevisSt. LuciaSt. Vincent and the GrenadinesSub-Saharan Africa Sub-Saharan Africa (excluding high income)Sub-Saharan Africa (IDA & IBRD countries)SudanSurinameSwazilandSwedenSwitzerlandSyrian Arab RepublicTajikistanTanzaniaThailandTimor-LesteTogoTongaTrinidad and TobagoTunisiaTurkeyTuvaluUgandaUkraineUnited Arab EmiratesUnited KingdomUnited StatesUpper middle incomeUruguayUzbekistanVanuatuVenezuela, RBWest Bank and GazaWorldYemen, Rep.ZambiaZimbabwe Timeline:
This timeline shows a graph from 1971 to 2015 of IBRD only. No data until 1970. Number of actual observations by date: 35.
Source name:
World Development Indicators
Source organization:
United Nations Educational, Scientific, and Cultural Organization (UNESCO) Institute for Statistics.
Categories, topics:
Education, Gender
Last updated:
apr 23, 2017
Indicators value changes by year
Minimum:
84.112
jan 1, 1971
Maximum:
93.592
jan 1, 2008
At the date of observation
Value
Absolute change
Change from previous value
jan 1, 1971
84.112
+84.112
0.0%
jan 1, 1972
84.226
+0.114
0.14%
jan 1, 1973
84.775
+0.549
0.65%
jan 1, 1976
87.304
+2.528
2.98%
jan 1, 1977
87.823
+0.52
0.6%
jan 1, 1978
88.267
+0.443
0.5%
jan 1, 1979
87.855
-0.412
-0.47%
jan 1, 1980
88.384
+0.529
0.6%
jan 1, 1981
88.894
+0.51
0.58%
jan 1, 1982
89.474
+0.58
0.65%
jan 1, 1988
91.908
+2.434
2.72%
jan 1, 1992
93.424
+1.516
1.65%
jan 1, 1993
93.229
-0.195
-0.21%
jan 1, 1994
92.86
-0.369
-0.4%
jan 1, 1995
92.402
-0.457
-0.49%
jan 1, 1996
91.371
-1.031
-1.12%
jan 1, 1997
90.779
-0.592
-0.65%
jan 1, 1998
90.234
-0.545
-0.6%
jan 1, 1999
90.558
+0.324
0.36%
jan 1, 2000
91.169
+0.611
0.68%
jan 1, 2001
91.48
+0.311
0.34%
jan 1, 2002
91.708
+0.227
0.25%
jan 1, 2003
92.604
+0.897
0.98%
jan 1, 2004
92.536
-0.068
-0.07%
jan 1, 2005
93.223
+0.687
0.74%
jan 1, 2006
92.386
-0.837
-0.9%
jan 1, 2007
92.654
+0.268
0.29%
jan 1, 2008
93.592
+0.938
1.01%
jan 1, 2009
93.296
-0.296
-0.32%
jan 1, 2010
93.053
-0.244
-0.26%
jan 1, 2011
93.275
+0.223
0.24%
jan 1, 2012
92.944
-0.331
-0.36%
jan 1, 2013
93.54
+0.596
0.64%
jan 1, 2014
93.395
-0.145
-0.16%
jan 1, 2015
93.33
-0.066
-0.07%
Ranking of countries by current statistics by years


Comments: