29
/
en
AIzaSyAYiBZKx7MnpbEhh9jyipgxe19OcubqV5w
April 1, 2024
60358
Sub-Saharan Africa (excluding high income)
SSA
false
2
1
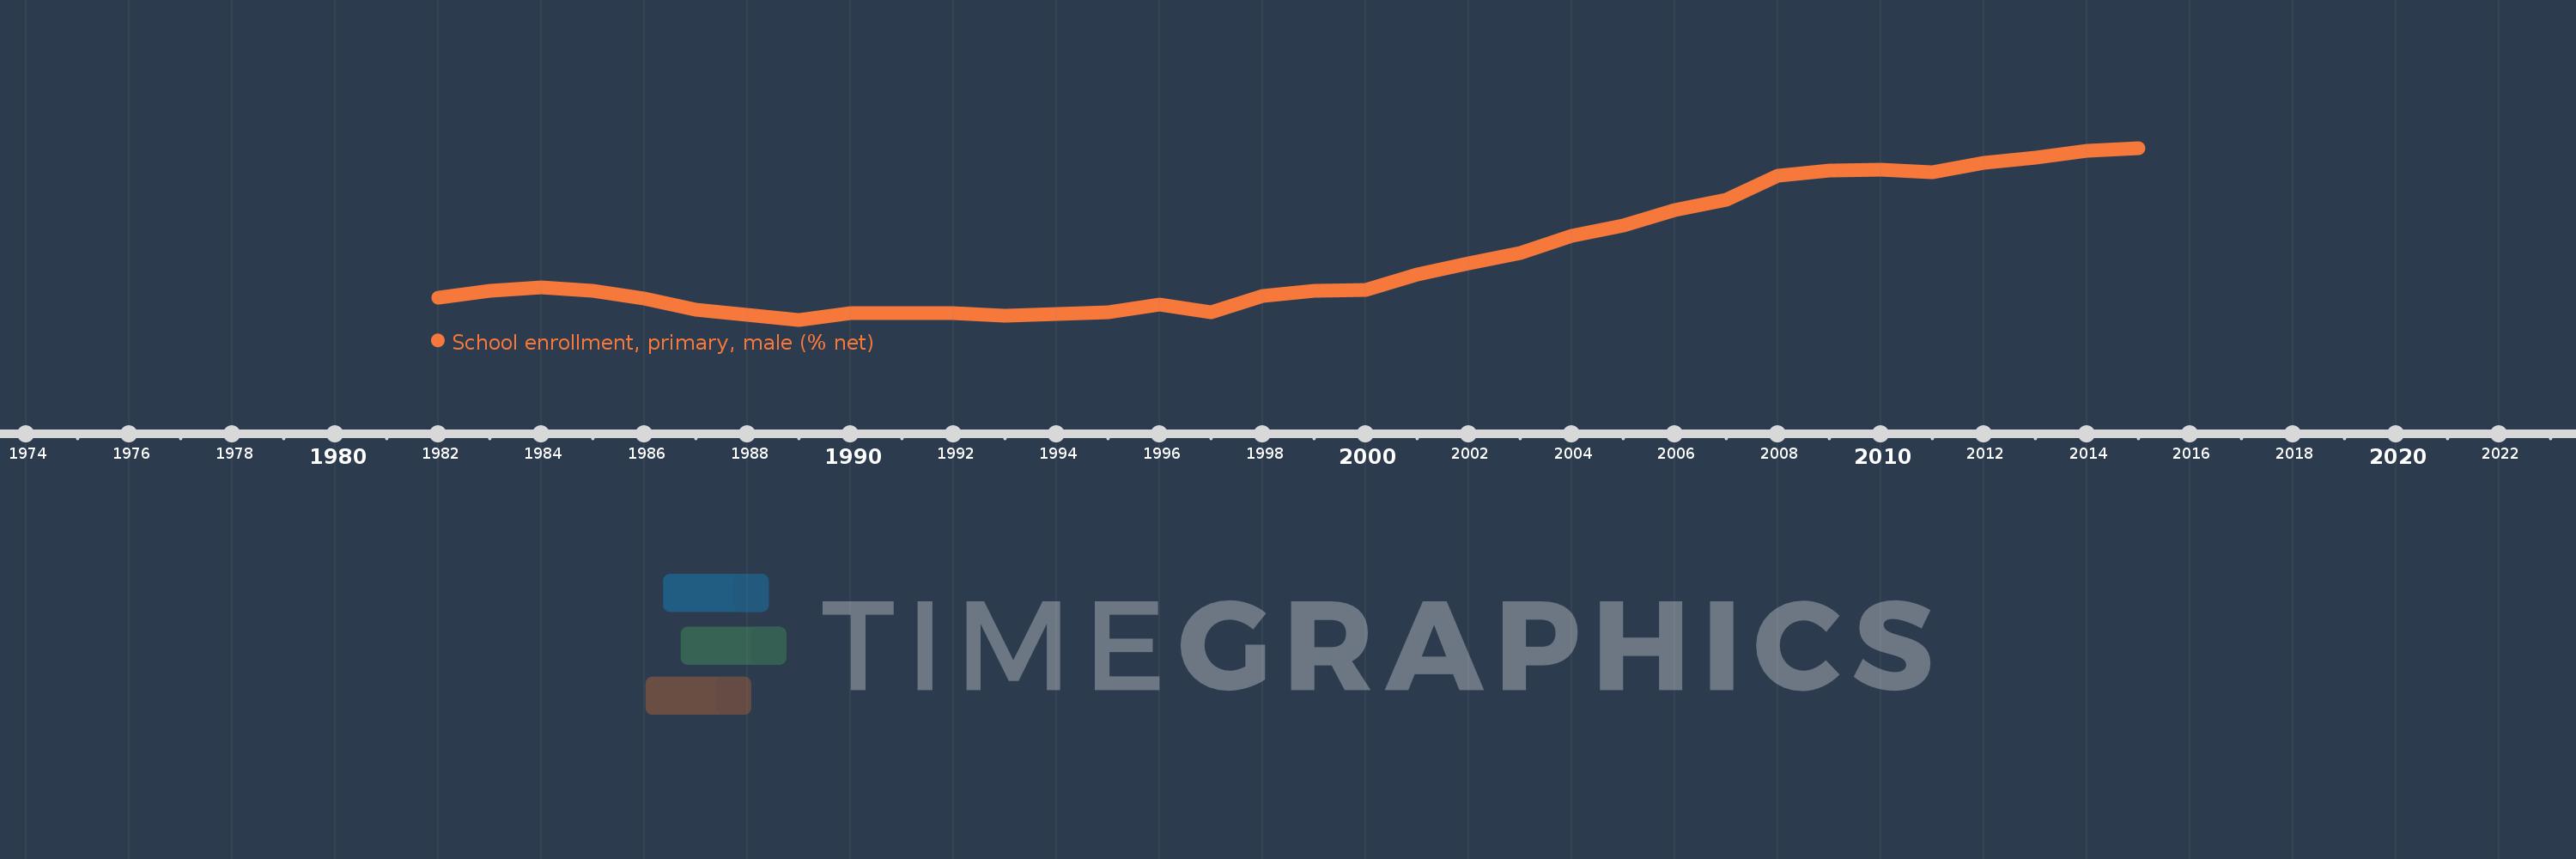
School enrollment, primary, male (% net)
2015,2014,2013,2012,2011,2010,2009,2008,2007,2006,2005,2004,2003,2002,2001,2000,1999,1998,1997,1996,1995,1994,1993,1992,1990,1989,1988,1987,1986,1985,1984,1983,1982
This statistics in other country:
AfghanistanAlbaniaAlgeriaAngolaAntigua and BarbudaArab WorldArgentinaArmeniaArubaAustraliaAustriaAzerbaijanBahamas, TheBahrainBangladeshBarbadosBelarusBelgiumBelizeBeninBermudaBhutanBoliviaBosnia and HerzegovinaBotswanaBrazilBrunei DarussalamBulgariaBurkina FasoBurundiCabo VerdeCambodiaCameroonCanadaCaribbean small statesCentral African RepublicCentral Europe and the BalticsChadChileChinaColombiaComorosCongo, Dem. Rep.Congo, Rep.Costa RicaCote d'IvoireCroatiaCubaCyprusDenmarkDjiboutiDominicaDominican RepublicEarly-demographic dividendEast Asia & PacificEast Asia & Pacific (excluding high income)East Asia & Pacific (IDA & IBRD countries)EcuadorEgypt, Arab Rep.El SalvadorEquatorial GuineaEritreaEstoniaEthiopiaEuro areaEurope & Central AsiaEurope & Central Asia (excluding high income)Europe & Central Asia (IDA & IBRD countries)European UnionFijiFinlandFragile and conflict affected situationsFranceGabonGambia, TheGeorgiaGhanaGreeceGrenadaGuatemalaGuineaGuinea-BissauGuyanaHaitiHeavily indebted poor countries (HIPC)High incomeHondurasHong Kong SAR, ChinaHungaryIBRD onlyIcelandIDA & IBRD totalIDA blendIDA onlyIDA totalIndiaIndonesiaIran, Islamic Rep.IraqIrelandIsraelItalyJamaicaJapanJordanKazakhstanKenyaKiribatiKorea, Dem. People’s Rep.Korea, Rep.KuwaitKyrgyz RepublicLao PDRLate-demographic dividendLatin America & Caribbean Latin America & Caribbean (excluding high income)Latin America & the Caribbean (IDA & IBRD countries)LatviaLeast developed countries: UN classificationLebanonLesothoLiberiaLibyaLiechtensteinLithuaniaLow & middle incomeLow incomeLower middle incomeLuxembourgMacao SAR, ChinaMacedonia, FYRMadagascarMalawiMaldivesMaliMaltaMarshall IslandsMauritaniaMauritiusMexicoMicronesia, Fed. Sts.Middle East & North AfricaMiddle East & North Africa (excluding high income)Middle East & North Africa (IDA & IBRD countries)Middle incomeMoldovaMongoliaMontenegroMoroccoMozambiqueMyanmarNamibiaNauruNepalNetherlandsNew ZealandNicaraguaNigerNigeriaNorth AmericaNorwayOECD membersOmanOther small statesPacific island small statesPakistanPanamaPapua New GuineaParaguayPeruPhilippinesPolandPortugalPost-demographic dividendPre-demographic dividendPuerto RicoQatarRomaniaRussian FederationRwandaSamoaSan MarinoSao Tome and PrincipeSaudi ArabiaSenegalSerbiaSeychellesSierra LeoneSloveniaSmall statesSolomon IslandsSomaliaSouth AfricaSouth AsiaSouth Asia (IDA & IBRD)South SudanSpainSri LankaSt. Kitts and NevisSt. LuciaSt. Vincent and the GrenadinesSub-Saharan Africa Sub-Saharan Africa (excluding high income)Sub-Saharan Africa (IDA & IBRD countries)SudanSurinameSwazilandSwedenSwitzerlandSyrian Arab RepublicTajikistanTanzaniaThailandTimor-LesteTogoTongaTrinidad and TobagoTunisiaTurkeyTuvaluUgandaUkraineUnited Arab EmiratesUnited KingdomUnited StatesUpper middle incomeUruguayUzbekistanVanuatuVenezuela, RBWest Bank and GazaWorldYemen, Rep.ZambiaZimbabwe Timeline:
This timeline shows a graph from 1982 to 2015 of Sub-Saharan Africa (excluding high income). No data until 1981. Number of actual observations by date: 33.
Source name:
World Development Indicators
Source organization:
United Nations Educational, Scientific, and Cultural Organization (UNESCO) Institute for Statistics.
Categories, topics:
Education, Gender
Last updated:
apr 23, 2017
Indicators value changes by year
Minimum:
57.117
jan 1, 1989
Maximum:
80.022
jan 1, 2015
At the date of observation
Value
Absolute change
Change from previous value
jan 1, 1982
60.064
+60.064
0.0%
jan 1, 1983
61.025
+0.961
1.6%
jan 1, 1984
61.445
+0.42
0.69%
jan 1, 1985
60.934
-0.511
-0.83%
jan 1, 1986
59.908
-1.026
-1.68%
jan 1, 1987
58.466
-1.442
-2.41%
jan 1, 1988
57.783
-0.683
-1.17%
jan 1, 1989
57.117
-0.667
-1.15%
jan 1, 1990
57.971
+0.854
1.5%
jan 1, 1992
58.027
+0.056
0.1%
jan 1, 1993
57.62
-0.407
-0.7%
jan 1, 1994
57.852
+0.232
0.4%
jan 1, 1995
58.113
+0.262
0.45%
jan 1, 1996
59.134
+1.021
1.76%
jan 1, 1997
58.088
-1.045
-1.77%
jan 1, 1998
60.292
+2.204
3.79%
jan 1, 1999
60.94
+0.648
1.07%
jan 1, 2000
61.07
+0.13
0.21%
jan 1, 2001
63.134
+2.064
3.38%
jan 1, 2002
64.622
+1.488
2.36%
jan 1, 2003
66.054
+1.432
2.22%
jan 1, 2004
68.265
+2.211
3.35%
jan 1, 2005
69.641
+1.376
2.02%
jan 1, 2006
71.721
+2.081
2.99%
jan 1, 2007
73.149
+1.428
1.99%
jan 1, 2008
76.334
+3.185
4.35%
jan 1, 2009
76.993
+0.659
0.86%
jan 1, 2010
77.086
+0.093
0.12%
jan 1, 2011
76.832
-0.254
-0.33%
jan 1, 2012
78.092
+1.261
1.64%
jan 1, 2013
78.748
+0.656
0.84%
jan 1, 2014
79.613
+0.865
1.1%
jan 1, 2015
80.022
+0.409
0.51%
Ranking of countries by current statistics by years


Comments: