29
/
en
AIzaSyAYiBZKx7MnpbEhh9jyipgxe19OcubqV5w
April 1, 2024
182534
Luxembourg
LUX
true
2
1
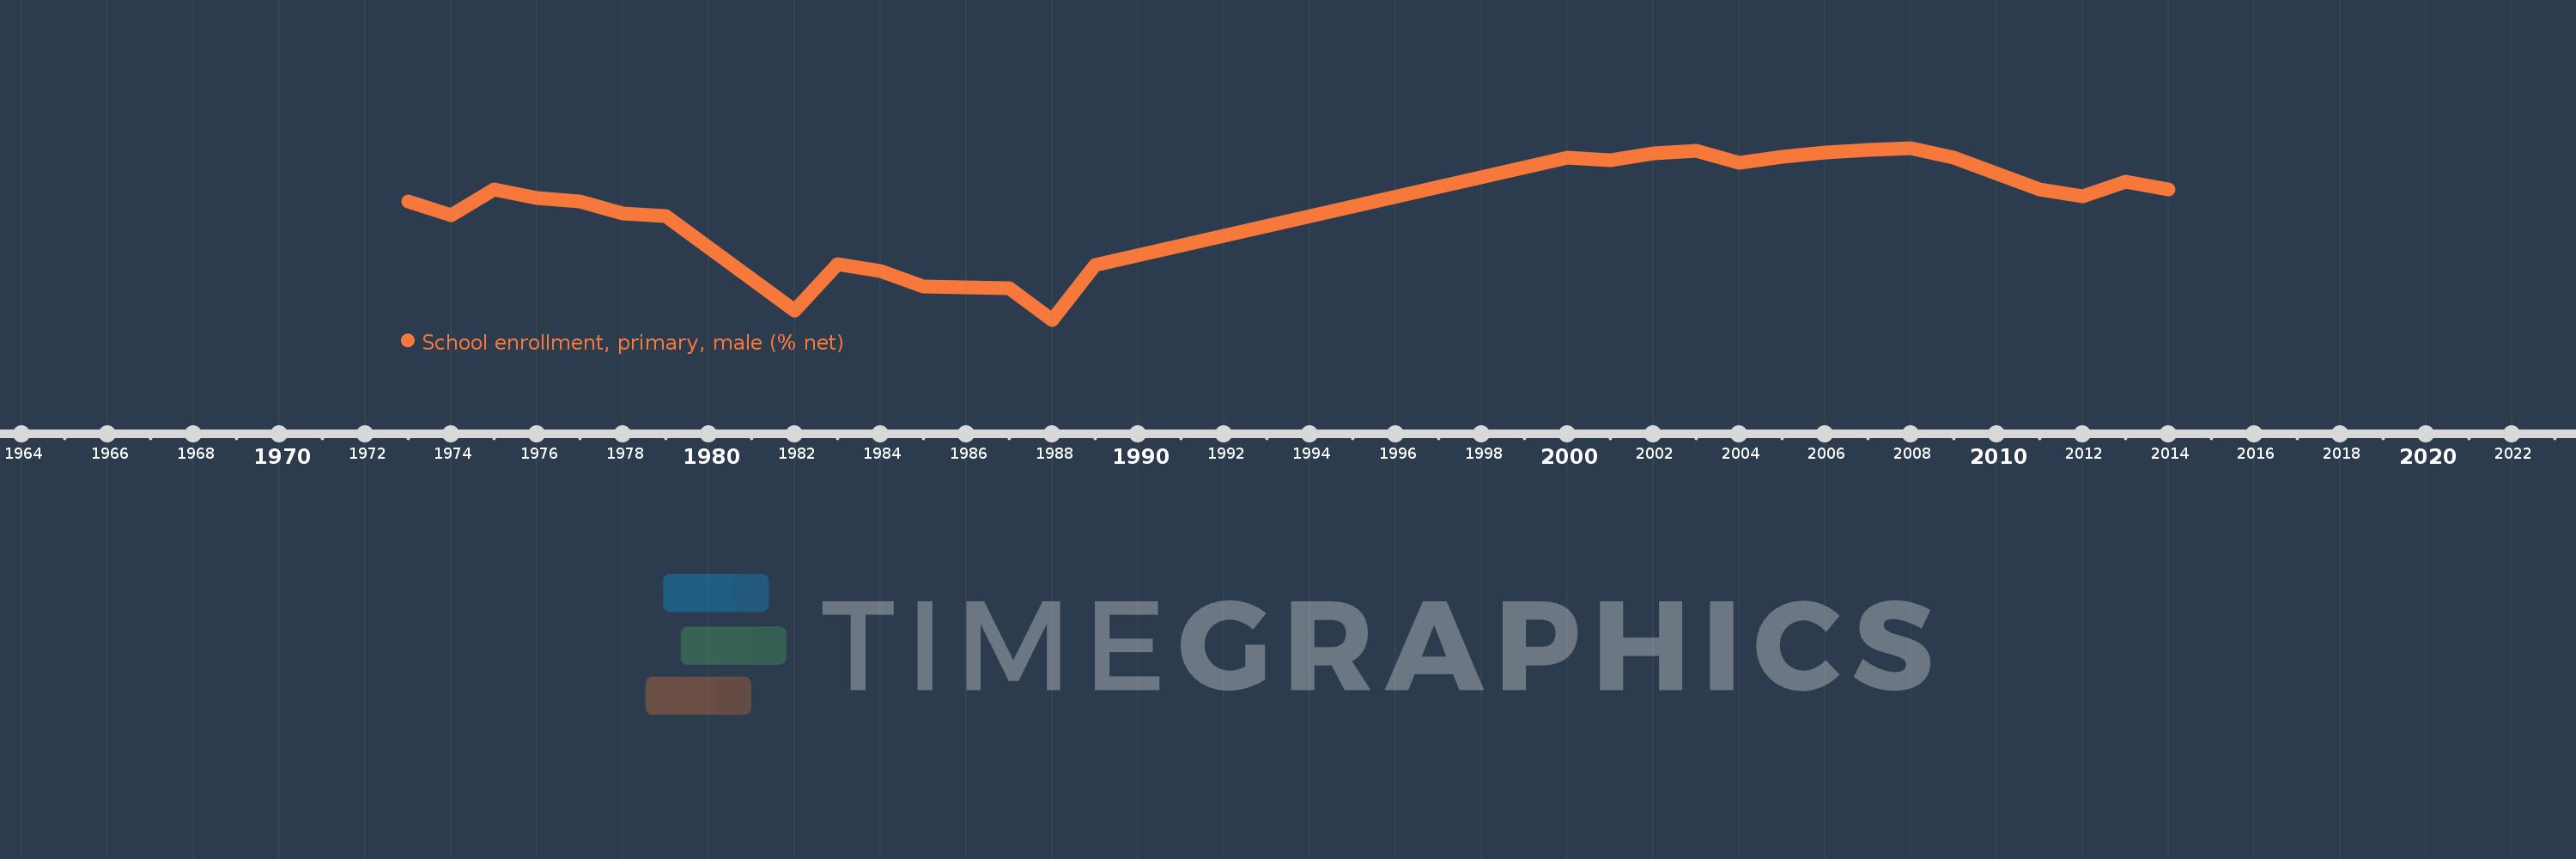
School enrollment, primary, male (% net)
2014,2013,2012,2011,2009,2008,2007,2006,2005,2004,2003,2002,2001,2000,1989,1988,1987,1985,1984,1983,1982,1979,1978,1977,1976,1975,1974,1973
This statistics in other country:
AfghanistanAlbaniaAlgeriaAngolaAntigua and BarbudaArab WorldArgentinaArmeniaArubaAustraliaAustriaAzerbaijanBahamas, TheBahrainBangladeshBarbadosBelarusBelgiumBelizeBeninBermudaBhutanBoliviaBosnia and HerzegovinaBotswanaBrazilBrunei DarussalamBulgariaBurkina FasoBurundiCabo VerdeCambodiaCameroonCanadaCaribbean small statesCentral African RepublicCentral Europe and the BalticsChadChileChinaColombiaComorosCongo, Dem. Rep.Congo, Rep.Costa RicaCote d'IvoireCroatiaCubaCyprusDenmarkDjiboutiDominicaDominican RepublicEarly-demographic dividendEast Asia & PacificEast Asia & Pacific (excluding high income)East Asia & Pacific (IDA & IBRD countries)EcuadorEgypt, Arab Rep.El SalvadorEquatorial GuineaEritreaEstoniaEthiopiaEuro areaEurope & Central AsiaEurope & Central Asia (excluding high income)Europe & Central Asia (IDA & IBRD countries)European UnionFijiFinlandFragile and conflict affected situationsFranceGabonGambia, TheGeorgiaGhanaGreeceGrenadaGuatemalaGuineaGuinea-BissauGuyanaHaitiHeavily indebted poor countries (HIPC)High incomeHondurasHong Kong SAR, ChinaHungaryIBRD onlyIcelandIDA & IBRD totalIDA blendIDA onlyIDA totalIndiaIndonesiaIran, Islamic Rep.IraqIrelandIsraelItalyJamaicaJapanJordanKazakhstanKenyaKiribatiKorea, Dem. People’s Rep.Korea, Rep.KuwaitKyrgyz RepublicLao PDRLate-demographic dividendLatin America & Caribbean Latin America & Caribbean (excluding high income)Latin America & the Caribbean (IDA & IBRD countries)LatviaLeast developed countries: UN classificationLebanonLesothoLiberiaLibyaLiechtensteinLithuaniaLow & middle incomeLow incomeLower middle incomeLuxembourgMacao SAR, ChinaMacedonia, FYRMadagascarMalawiMaldivesMaliMaltaMarshall IslandsMauritaniaMauritiusMexicoMicronesia, Fed. Sts.Middle East & North AfricaMiddle East & North Africa (excluding high income)Middle East & North Africa (IDA & IBRD countries)Middle incomeMoldovaMongoliaMontenegroMoroccoMozambiqueMyanmarNamibiaNauruNepalNetherlandsNew ZealandNicaraguaNigerNigeriaNorth AmericaNorwayOECD membersOmanOther small statesPacific island small statesPakistanPanamaPapua New GuineaParaguayPeruPhilippinesPolandPortugalPost-demographic dividendPre-demographic dividendPuerto RicoQatarRomaniaRussian FederationRwandaSamoaSan MarinoSao Tome and PrincipeSaudi ArabiaSenegalSerbiaSeychellesSierra LeoneSloveniaSmall statesSolomon IslandsSomaliaSouth AfricaSouth AsiaSouth Asia (IDA & IBRD)South SudanSpainSri LankaSt. Kitts and NevisSt. LuciaSt. Vincent and the GrenadinesSub-Saharan Africa Sub-Saharan Africa (excluding high income)Sub-Saharan Africa (IDA & IBRD countries)SudanSurinameSwazilandSwedenSwitzerlandSyrian Arab RepublicTajikistanTanzaniaThailandTimor-LesteTogoTongaTrinidad and TobagoTunisiaTurkeyTuvaluUgandaUkraineUnited Arab EmiratesUnited KingdomUnited StatesUpper middle incomeUruguayUzbekistanVanuatuVenezuela, RBWest Bank and GazaWorldYemen, Rep.ZambiaZimbabwe Timeline:
This timeline shows a graph from 1973 to 2014 of Luxembourg. No data until 1972. Number of actual observations by date: 28.
Source name:
World Development Indicators
Source organization:
United Nations Educational, Scientific, and Cultural Organization (UNESCO) Institute for Statistics.
Categories, topics:
Education, Gender
Last updated:
apr 23, 2017
Indicators value changes by year
Minimum:
77.803
jan 1, 1988
Maximum:
96.263
jan 1, 2008
At the date of observation
Value
Absolute change
Change from previous value
jan 1, 1973
90.492
+90.492
0.0%
jan 1, 1974
89.022
-1.47
-1.62%
jan 1, 1975
91.841
+2.82
3.17%
jan 1, 1976
90.899
-0.942
-1.03%
jan 1, 1977
90.496
-0.404
-0.44%
jan 1, 1978
89.176
-1.319
-1.46%
jan 1, 1979
88.95
-0.226
-0.25%
jan 1, 1982
78.766
-10.185
-11.45%
jan 1, 1983
83.737
+4.971
6.31%
jan 1, 1984
83.001
-0.735
-0.88%
jan 1, 1985
81.329
-1.672
-2.01%
jan 1, 1987
81.198
-0.131
-0.16%
jan 1, 1988
77.803
-3.395
-4.18%
jan 1, 1989
83.713
+5.91
7.6%
jan 1, 2000
95.218
+11.504
13.74%
jan 1, 2001
94.955
-0.262
-0.28%
jan 1, 2002
95.707
+0.752
0.79%
jan 1, 2003
95.969
+0.262
0.27%
jan 1, 2004
94.649
-1.32
-1.37%
jan 1, 2005
95.336
+0.687
0.73%
jan 1, 2006
95.805
+0.469
0.49%
jan 1, 2007
96.079
+0.274
0.29%
jan 1, 2008
96.263
+0.184
0.19%
jan 1, 2009
95.216
-1.047
-1.09%
jan 1, 2011
91.848
-3.368
-3.54%
jan 1, 2012
91.09
-0.758
-0.83%
jan 1, 2013
92.616
+1.526
1.68%
jan 1, 2014
91.848
-0.768
-0.83%
Ranking of countries by current statistics by years


Comments: