29
/
en
AIzaSyAYiBZKx7MnpbEhh9jyipgxe19OcubqV5w
April 1, 2024
203591
Mozambique
MOZ
true
2
1
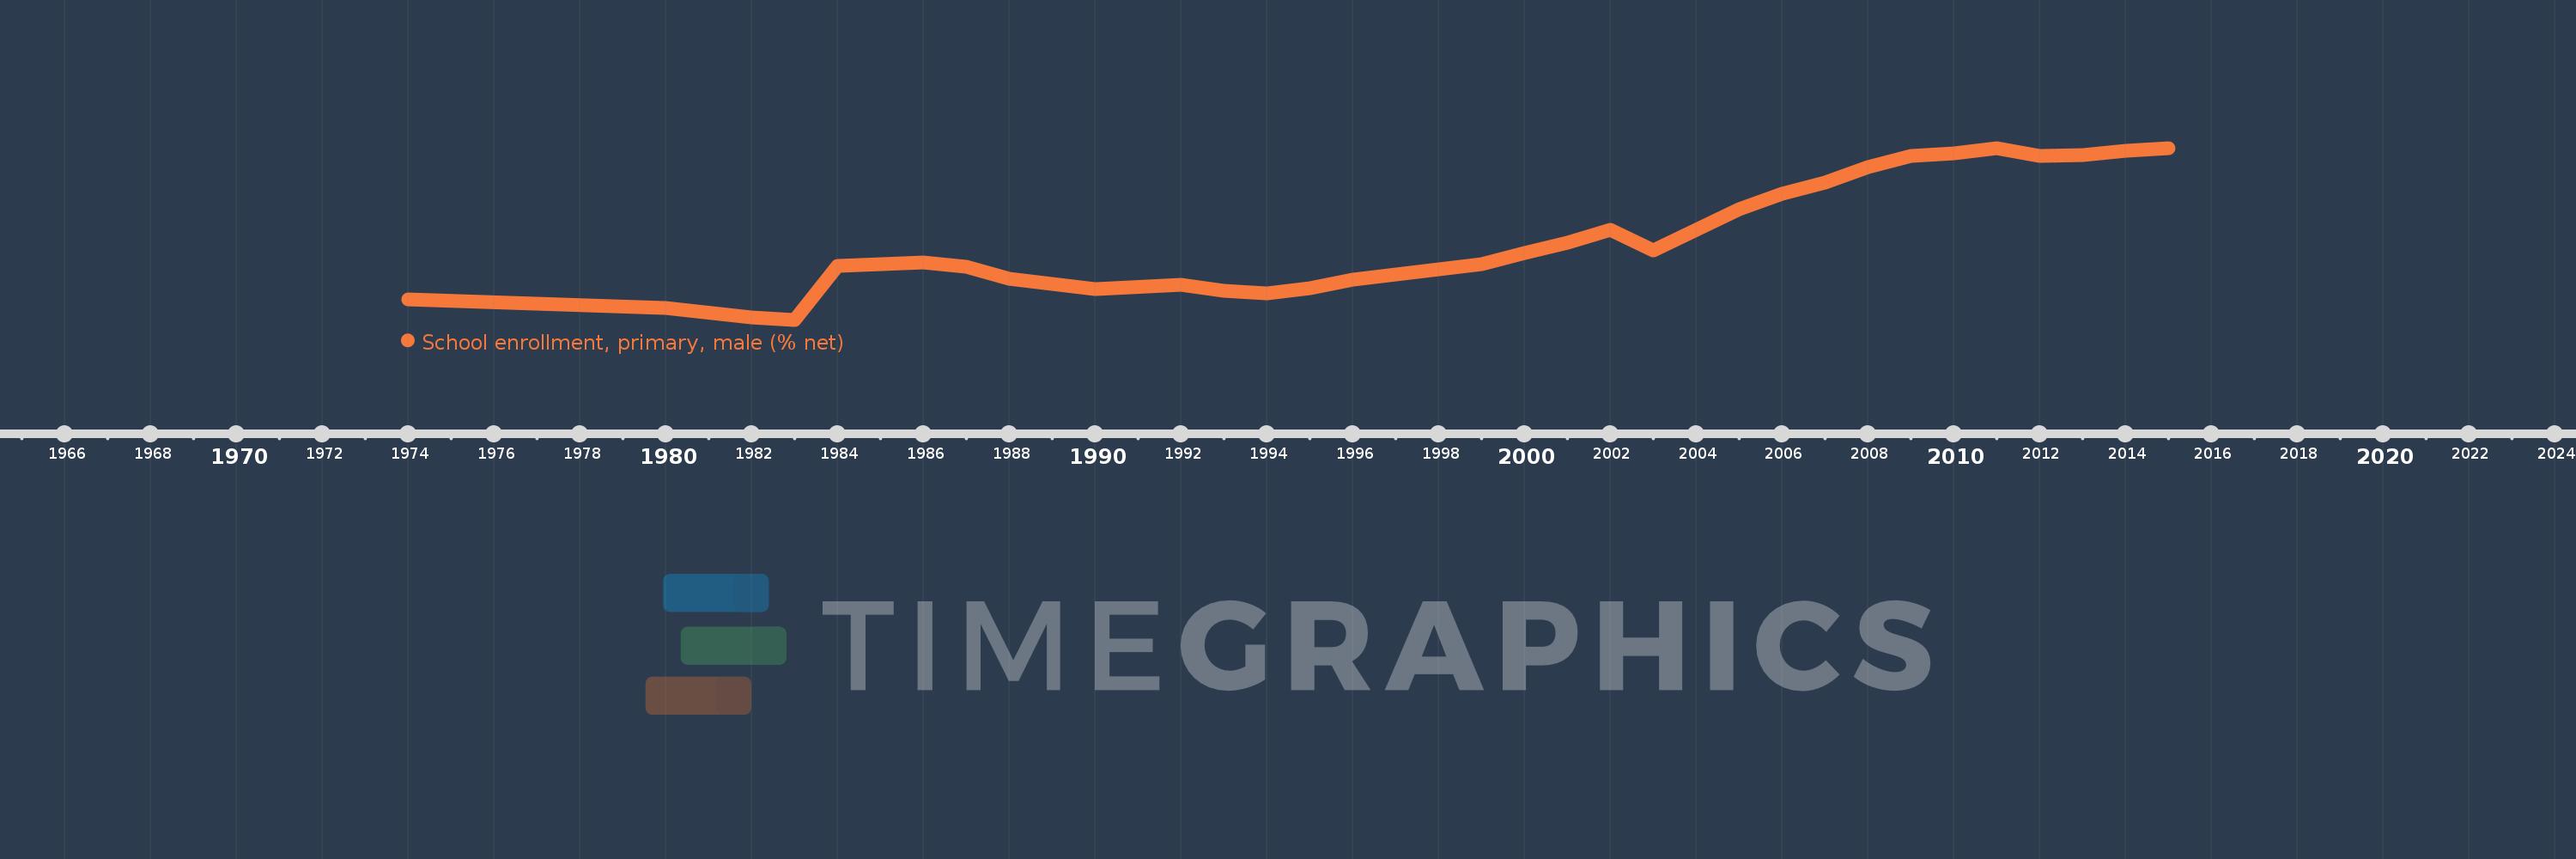
School enrollment, primary, male (% net)
2015,2014,2013,2012,2011,2010,2009,2008,2007,2006,2005,2003,2002,2001,2000,1999,1996,1995,1994,1993,1992,1990,1988,1987,1986,1984,1983,1982,1980,1974
This statistics in other country:
AfghanistanAlbaniaAlgeriaAngolaAntigua and BarbudaArab WorldArgentinaArmeniaArubaAustraliaAustriaAzerbaijanBahamas, TheBahrainBangladeshBarbadosBelarusBelgiumBelizeBeninBermudaBhutanBoliviaBosnia and HerzegovinaBotswanaBrazilBrunei DarussalamBulgariaBurkina FasoBurundiCabo VerdeCambodiaCameroonCanadaCaribbean small statesCentral African RepublicCentral Europe and the BalticsChadChileChinaColombiaComorosCongo, Dem. Rep.Congo, Rep.Costa RicaCote d'IvoireCroatiaCubaCyprusDenmarkDjiboutiDominicaDominican RepublicEarly-demographic dividendEast Asia & PacificEast Asia & Pacific (excluding high income)East Asia & Pacific (IDA & IBRD countries)EcuadorEgypt, Arab Rep.El SalvadorEquatorial GuineaEritreaEstoniaEthiopiaEuro areaEurope & Central AsiaEurope & Central Asia (excluding high income)Europe & Central Asia (IDA & IBRD countries)European UnionFijiFinlandFragile and conflict affected situationsFranceGabonGambia, TheGeorgiaGhanaGreeceGrenadaGuatemalaGuineaGuinea-BissauGuyanaHaitiHeavily indebted poor countries (HIPC)High incomeHondurasHong Kong SAR, ChinaHungaryIBRD onlyIcelandIDA & IBRD totalIDA blendIDA onlyIDA totalIndiaIndonesiaIran, Islamic Rep.IraqIrelandIsraelItalyJamaicaJapanJordanKazakhstanKenyaKiribatiKorea, Dem. People’s Rep.Korea, Rep.KuwaitKyrgyz RepublicLao PDRLate-demographic dividendLatin America & Caribbean Latin America & Caribbean (excluding high income)Latin America & the Caribbean (IDA & IBRD countries)LatviaLeast developed countries: UN classificationLebanonLesothoLiberiaLibyaLiechtensteinLithuaniaLow & middle incomeLow incomeLower middle incomeLuxembourgMacao SAR, ChinaMacedonia, FYRMadagascarMalawiMaldivesMaliMaltaMarshall IslandsMauritaniaMauritiusMexicoMicronesia, Fed. Sts.Middle East & North AfricaMiddle East & North Africa (excluding high income)Middle East & North Africa (IDA & IBRD countries)Middle incomeMoldovaMongoliaMontenegroMoroccoMozambiqueMyanmarNamibiaNauruNepalNetherlandsNew ZealandNicaraguaNigerNigeriaNorth AmericaNorwayOECD membersOmanOther small statesPacific island small statesPakistanPanamaPapua New GuineaParaguayPeruPhilippinesPolandPortugalPost-demographic dividendPre-demographic dividendPuerto RicoQatarRomaniaRussian FederationRwandaSamoaSan MarinoSao Tome and PrincipeSaudi ArabiaSenegalSerbiaSeychellesSierra LeoneSloveniaSmall statesSolomon IslandsSomaliaSouth AfricaSouth AsiaSouth Asia (IDA & IBRD)South SudanSpainSri LankaSt. Kitts and NevisSt. LuciaSt. Vincent and the GrenadinesSub-Saharan Africa Sub-Saharan Africa (excluding high income)Sub-Saharan Africa (IDA & IBRD countries)SudanSurinameSwazilandSwedenSwitzerlandSyrian Arab RepublicTajikistanTanzaniaThailandTimor-LesteTogoTongaTrinidad and TobagoTunisiaTurkeyTuvaluUgandaUkraineUnited Arab EmiratesUnited KingdomUnited StatesUpper middle incomeUruguayUzbekistanVanuatuVenezuela, RBWest Bank and GazaWorldYemen, Rep.ZambiaZimbabwe Timeline:
This timeline shows a graph from 1974 to 2015 of Mozambique. No data until 1973. Number of actual observations by date: 30.
Source name:
World Development Indicators
Source organization:
United Nations Educational, Scientific, and Cultural Organization (UNESCO) Institute for Statistics.
Categories, topics:
Education, Gender
Last updated:
apr 23, 2017
Indicators value changes by year
Maximum:
89.661
jan 1, 2015
At the date of observation
Value
Absolute change
Change from previous value
jan 1, 1974
43.611
+43.611
0.0%
jan 1, 1980
41.161
-2.45
-5.62%
jan 1, 1982
38.18
-2.981
-7.24%
jan 1, 1983
37.48
-0.701
-1.83%
jan 1, 1984
53.801
+16.321
43.55%
jan 1, 1986
54.936
+1.135
2.11%
jan 1, 1987
53.577
-1.359
-2.47%
jan 1, 1988
49.957
-3.619
-6.76%
jan 1, 1990
46.777
-3.181
-6.37%
jan 1, 1992
48.031
+1.254
2.68%
jan 1, 1993
46.202
-1.829
-3.81%
jan 1, 1994
45.535
-0.668
-1.44%
jan 1, 1995
47.078
+1.543
3.39%
jan 1, 1996
49.662
+2.584
5.49%
jan 1, 1999
54.445
+4.783
9.63%
jan 1, 2000
57.659
+3.214
5.9%
jan 1, 2001
60.875
+3.217
5.58%
jan 1, 2002
64.79
+3.915
6.43%
jan 1, 2003
58.649
-6.141
-9.48%
jan 1, 2005
71.004
+12.355
21.07%
jan 1, 2006
75.742
+4.739
6.67%
jan 1, 2007
79.119
+3.377
4.46%
jan 1, 2008
83.956
+4.837
6.11%
jan 1, 2009
87.191
+3.235
3.85%
jan 1, 2010
87.939
+0.748
0.86%
jan 1, 2011
89.5
+1.561
1.77%
jan 1, 2012
87.183
-2.317
-2.59%
jan 1, 2013
87.576
+0.393
0.45%
jan 1, 2014
88.791
+1.215
1.39%
jan 1, 2015
89.661
+0.87
0.98%
Ranking of countries by current statistics by years


Comments: