29
/
en
AIzaSyAYiBZKx7MnpbEhh9jyipgxe19OcubqV5w
April 1, 2024
42978
Latin America & Caribbean (excluding high income)
LAC
false
2
1
School enrollment, primary, male (% net)
2015,2014,2013,2012,2011,2010,2009,2008,2007,2006,2005,2004,2003,2002,2001,2000,1999,1998,1997,1996,1995,1994,1993,1992,1991,1990,1989,1988,1987,1986,1985,1984,1983,1982,1981,1980,1979,1978,1977,1976,1975,1974,1973,1972,1971
This statistics in other country:
AfghanistanAlbaniaAlgeriaAngolaAntigua and BarbudaArab WorldArgentinaArmeniaArubaAustraliaAustriaAzerbaijanBahamas, TheBahrainBangladeshBarbadosBelarusBelgiumBelizeBeninBermudaBhutanBoliviaBosnia and HerzegovinaBotswanaBrazilBrunei DarussalamBulgariaBurkina FasoBurundiCabo VerdeCambodiaCameroonCanadaCaribbean small statesCentral African RepublicCentral Europe and the BalticsChadChileChinaColombiaComorosCongo, Dem. Rep.Congo, Rep.Costa RicaCote d'IvoireCroatiaCubaCyprusDenmarkDjiboutiDominicaDominican RepublicEarly-demographic dividendEast Asia & PacificEast Asia & Pacific (excluding high income)East Asia & Pacific (IDA & IBRD countries)EcuadorEgypt, Arab Rep.El SalvadorEquatorial GuineaEritreaEstoniaEthiopiaEuro areaEurope & Central AsiaEurope & Central Asia (excluding high income)Europe & Central Asia (IDA & IBRD countries)European UnionFijiFinlandFragile and conflict affected situationsFranceGabonGambia, TheGeorgiaGhanaGreeceGrenadaGuatemalaGuineaGuinea-BissauGuyanaHaitiHeavily indebted poor countries (HIPC)High incomeHondurasHong Kong SAR, ChinaHungaryIBRD onlyIcelandIDA & IBRD totalIDA blendIDA onlyIDA totalIndiaIndonesiaIran, Islamic Rep.IraqIrelandIsraelItalyJamaicaJapanJordanKazakhstanKenyaKiribatiKorea, Dem. People’s Rep.Korea, Rep.KuwaitKyrgyz RepublicLao PDRLate-demographic dividendLatin America & Caribbean Latin America & Caribbean (excluding high income)Latin America & the Caribbean (IDA & IBRD countries)LatviaLeast developed countries: UN classificationLebanonLesothoLiberiaLibyaLiechtensteinLithuaniaLow & middle incomeLow incomeLower middle incomeLuxembourgMacao SAR, ChinaMacedonia, FYRMadagascarMalawiMaldivesMaliMaltaMarshall IslandsMauritaniaMauritiusMexicoMicronesia, Fed. Sts.Middle East & North AfricaMiddle East & North Africa (excluding high income)Middle East & North Africa (IDA & IBRD countries)Middle incomeMoldovaMongoliaMontenegroMoroccoMozambiqueMyanmarNamibiaNauruNepalNetherlandsNew ZealandNicaraguaNigerNigeriaNorth AmericaNorwayOECD membersOmanOther small statesPacific island small statesPakistanPanamaPapua New GuineaParaguayPeruPhilippinesPolandPortugalPost-demographic dividendPre-demographic dividendPuerto RicoQatarRomaniaRussian FederationRwandaSamoaSan MarinoSao Tome and PrincipeSaudi ArabiaSenegalSerbiaSeychellesSierra LeoneSloveniaSmall statesSolomon IslandsSomaliaSouth AfricaSouth AsiaSouth Asia (IDA & IBRD)South SudanSpainSri LankaSt. Kitts and NevisSt. LuciaSt. Vincent and the GrenadinesSub-Saharan Africa Sub-Saharan Africa (excluding high income)Sub-Saharan Africa (IDA & IBRD countries)SudanSurinameSwazilandSwedenSwitzerlandSyrian Arab RepublicTajikistanTanzaniaThailandTimor-LesteTogoTongaTrinidad and TobagoTunisiaTurkeyTuvaluUgandaUkraineUnited Arab EmiratesUnited KingdomUnited StatesUpper middle incomeUruguayUzbekistanVanuatuVenezuela, RBWest Bank and GazaWorldYemen, Rep.ZambiaZimbabwe Timeline:
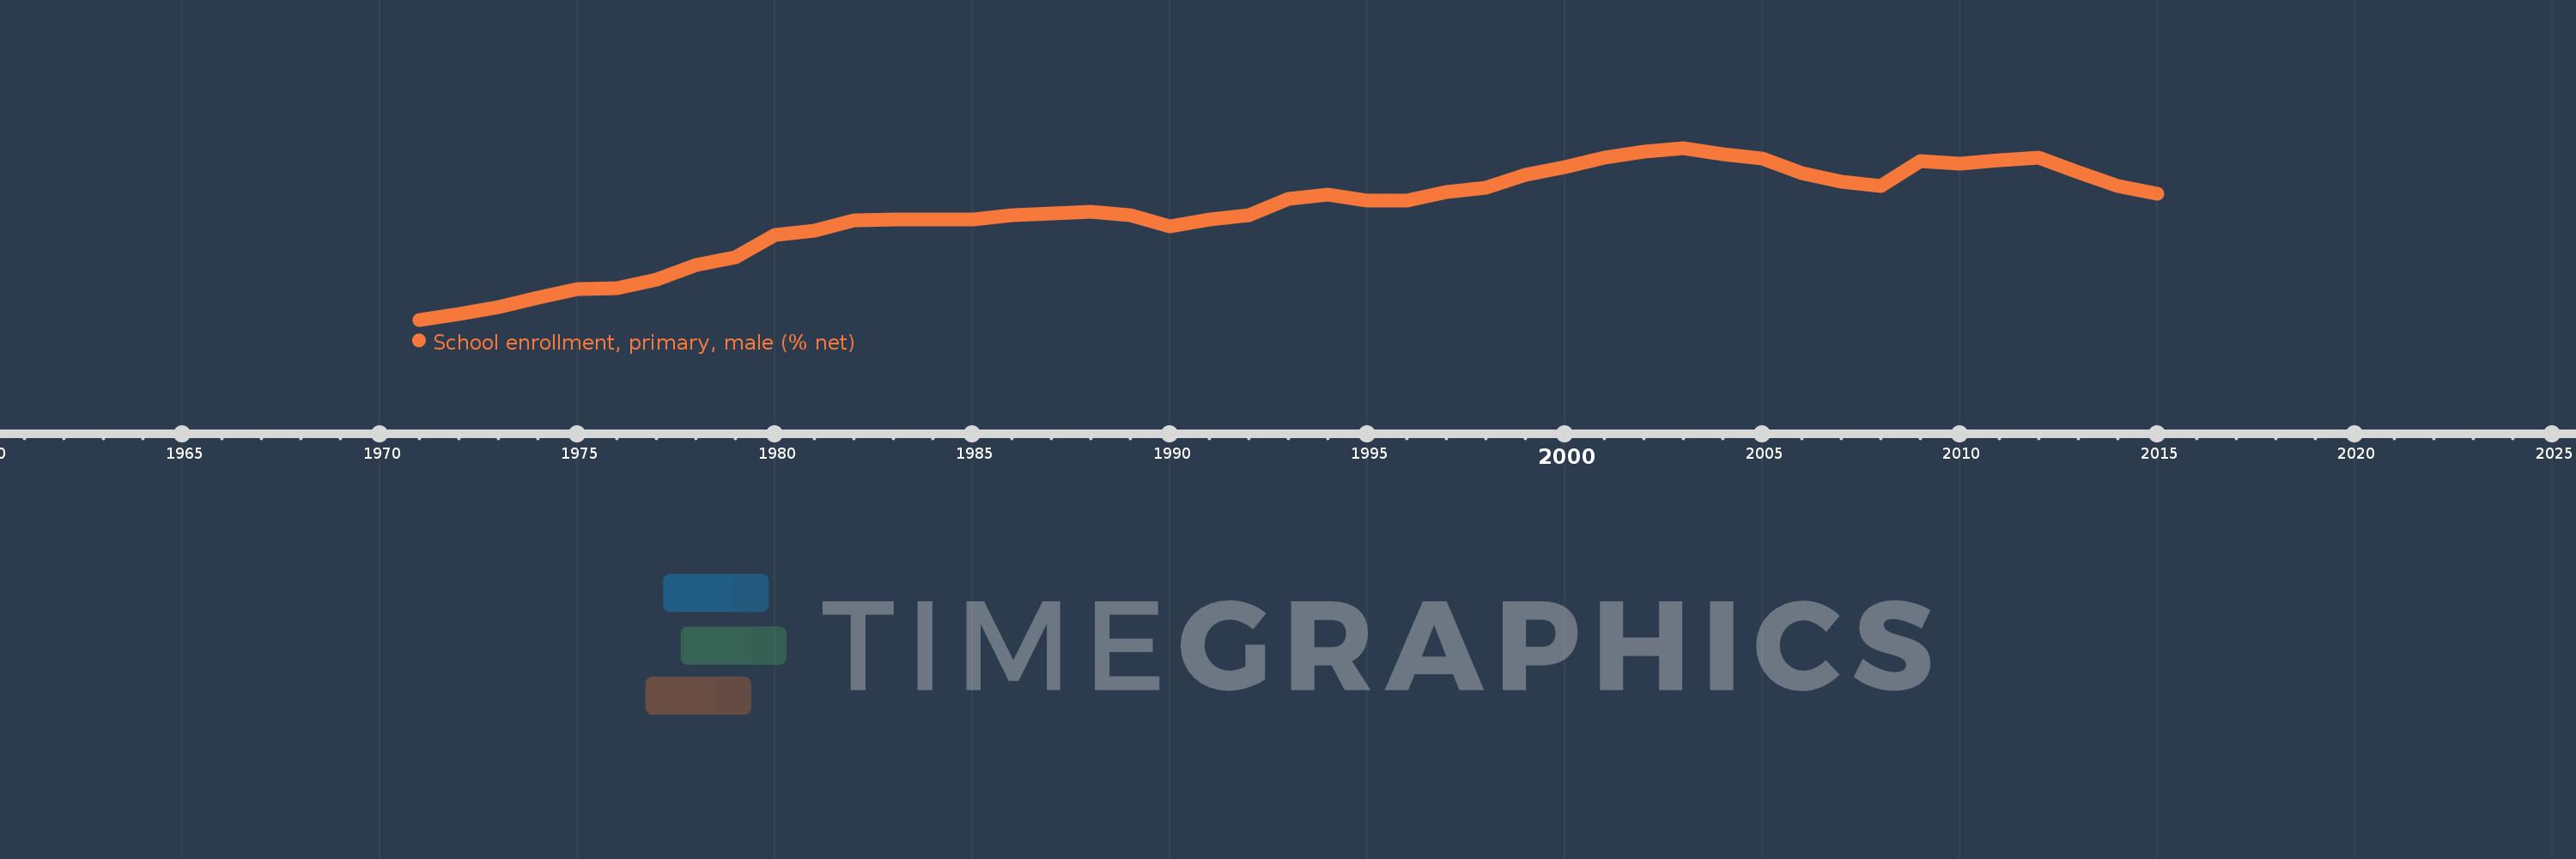
This timeline shows a graph from 1971 to 2015 of Latin America & Caribbean (excluding high income). No data until 1970. Number of actual observations by date: 45.
Source name:
World Development Indicators
Source organization:
United Nations Educational, Scientific, and Cultural Organization (UNESCO) Institute for Statistics.
Categories, topics:
Education, Gender
Last updated:
apr 23, 2017
Indicators value changes by year
Minimum:
82.602
jan 1, 1971
Maximum:
95.025
jan 1, 2003
At the date of observation
Value
Absolute change
Change from previous value
jan 1, 1971
82.602
+82.602
0.0%
jan 1, 1972
83.049
+0.448
0.54%
jan 1, 1973
83.544
+0.495
0.6%
jan 1, 1974
84.208
+0.664
0.79%
jan 1, 1975
84.796
+0.588
0.7%
jan 1, 1976
84.893
+0.097
0.11%
jan 1, 1977
85.529
+0.636
0.75%
jan 1, 1978
86.563
+1.034
1.21%
jan 1, 1979
87.144
+0.581
0.67%
jan 1, 1980
88.757
+1.614
1.85%
jan 1, 1981
89.052
+0.294
0.33%
jan 1, 1982
89.799
+0.747
0.84%
jan 1, 1983
89.828
+0.03
0.03%
jan 1, 1984
89.83
+0.002
0.0%
jan 1, 1985
89.881
+0.051
0.06%
jan 1, 1986
90.149
+0.267
0.3%
jan 1, 1987
90.277
+0.128
0.14%
jan 1, 1988
90.397
+0.12
0.13%
jan 1, 1989
90.158
-0.239
-0.26%
jan 1, 1990
89.376
-0.781
-0.87%
jan 1, 1991
89.846
+0.47
0.53%
jan 1, 1992
90.168
+0.321
0.36%
jan 1, 1993
91.322
+1.154
1.28%
jan 1, 1994
91.636
+0.315
0.34%
jan 1, 1995
91.204
-0.432
-0.47%
jan 1, 1996
91.213
+0.009
0.01%
jan 1, 1997
91.844
+0.631
0.69%
jan 1, 1998
92.178
+0.334
0.36%
jan 1, 1999
93.065
+0.887
0.96%
jan 1, 2000
93.625
+0.559
0.6%
jan 1, 2001
94.353
+0.729
0.78%
jan 1, 2002
94.767
+0.414
0.44%
jan 1, 2003
95.025
+0.258
0.27%
jan 1, 2004
94.586
-0.44
-0.46%
jan 1, 2005
94.278
-0.308
-0.33%
jan 1, 2006
93.235
-1.043
-1.11%
jan 1, 2007
92.613
-0.623
-0.67%
jan 1, 2008
92.27
-0.343
-0.37%
jan 1, 2009
94.065
+1.795
1.95%
jan 1, 2010
93.872
-0.193
-0.21%
jan 1, 2011
94.124
+0.252
0.27%
jan 1, 2012
94.298
+0.174
0.19%
jan 1, 2013
93.251
-1.047
-1.11%
jan 1, 2014
92.266
-0.985
-1.06%
jan 1, 2015
91.707
-0.559
-0.61%
Ranking of countries by current statistics by years


Comments: