29
/
en
AIzaSyAYiBZKx7MnpbEhh9jyipgxe19OcubqV5w
April 1, 2024
34234
Fragile and conflict affected situations
FCS
false
2
1
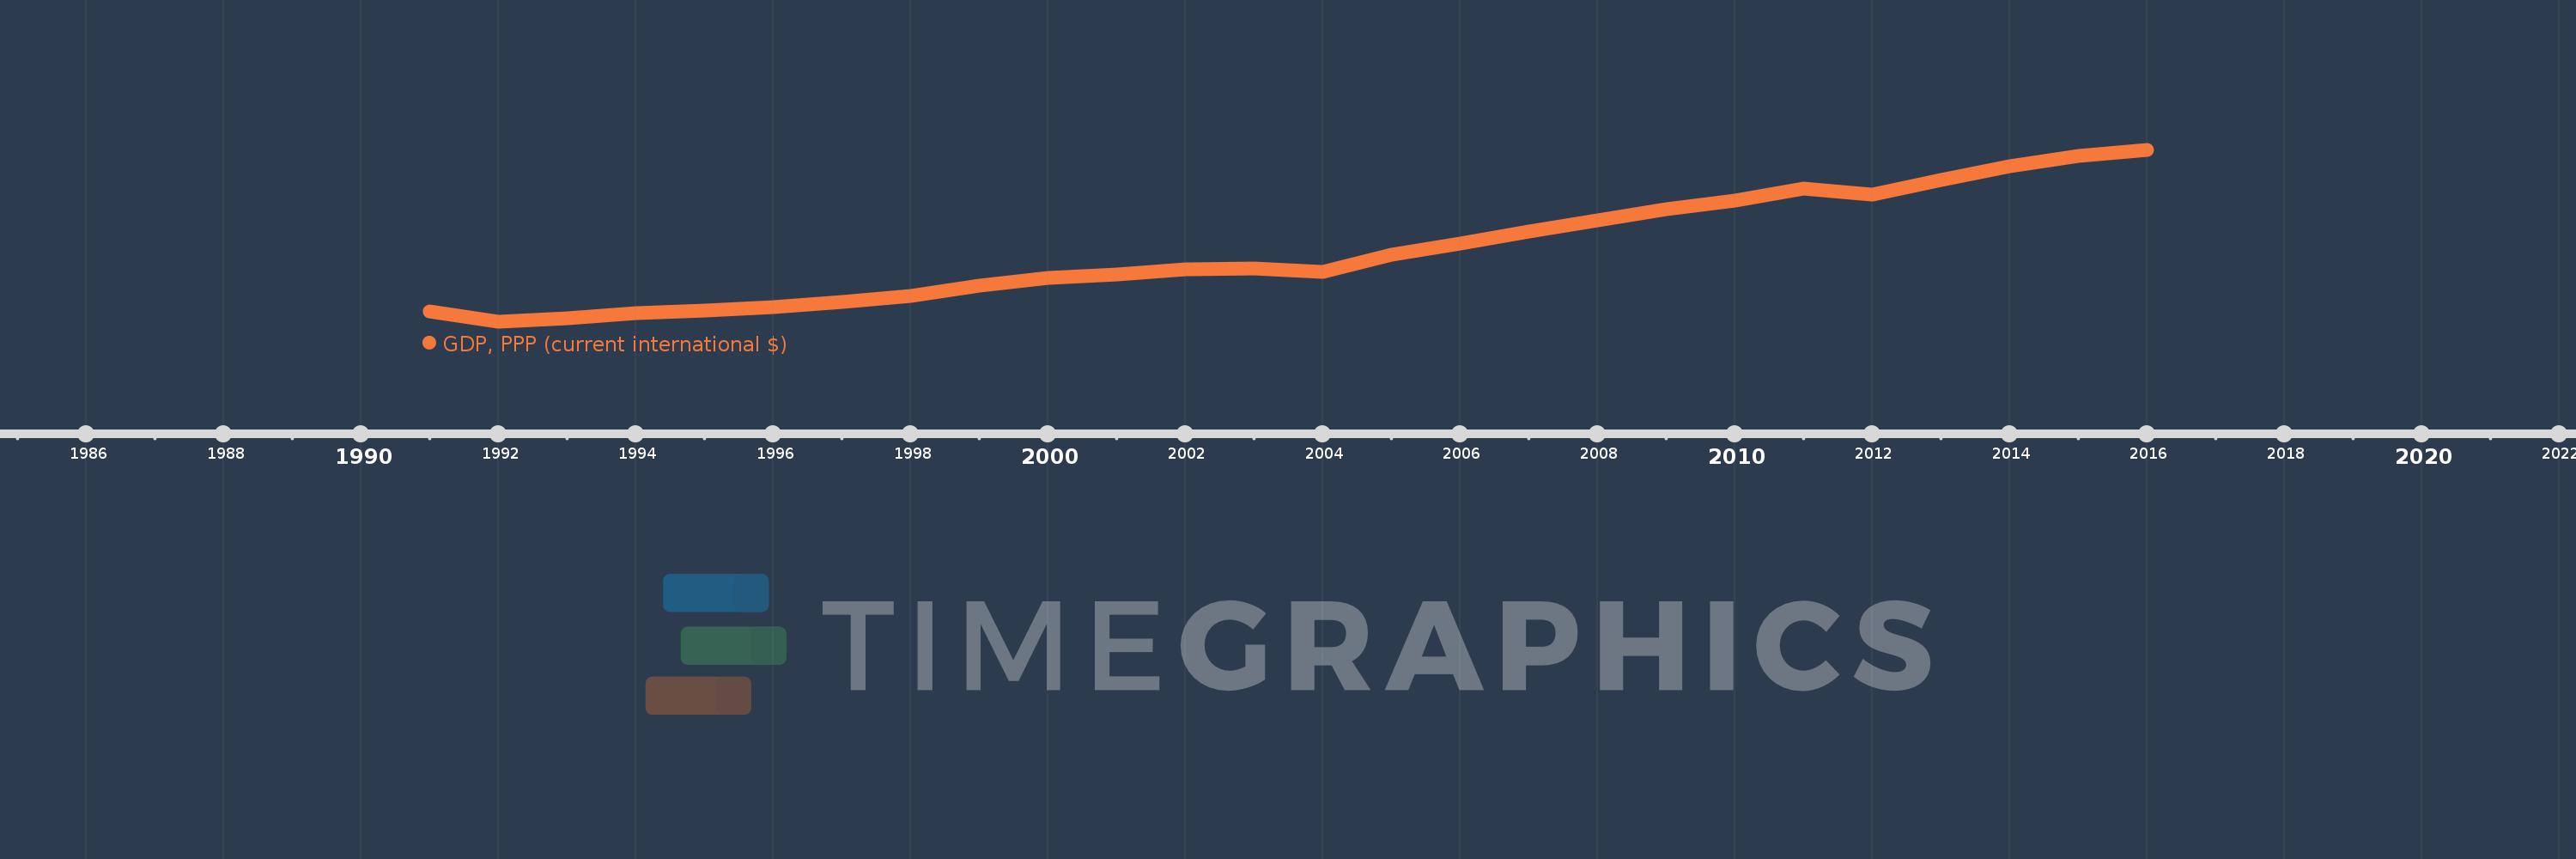
GDP, PPP (current international $)
2016,2015,2014,2013,2012,2011,2010,2009,2008,2007,2006,2005,2004,2003,2002,2001,2000,1999,1998,1997,1996,1995,1994,1993,1992,1991
This statistics in other country:
AfghanistanAlbaniaAlgeriaAngolaAntigua and BarbudaArab WorldArgentinaArmeniaArubaAustraliaAustriaAzerbaijanBahamas, TheBahrainBangladeshBarbadosBelarusBelgiumBelizeBeninBermudaBhutanBoliviaBosnia and HerzegovinaBotswanaBrazilBrunei DarussalamBulgariaBurkina FasoBurundiCabo VerdeCambodiaCameroonCanadaCaribbean small statesCayman IslandsCentral African RepublicCentral Europe and the BalticsChadChileChinaColombiaComorosCongo, Dem. Rep.Congo, Rep.Costa RicaCote d'IvoireCroatiaCubaCyprusCzech RepublicDenmarkDjiboutiDominicaDominican RepublicEarly-demographic dividendEast Asia & PacificEast Asia & Pacific (excluding high income)East Asia & Pacific (IDA & IBRD countries)EcuadorEgypt, Arab Rep.El SalvadorEquatorial GuineaEritreaEstoniaEthiopiaEuro areaEurope & Central AsiaEurope & Central Asia (excluding high income)Europe & Central Asia (IDA & IBRD countries)European UnionFijiFinlandFragile and conflict affected situationsFranceGabonGambia, TheGeorgiaGermanyGhanaGreeceGrenadaGuatemalaGuineaGuinea-BissauGuyanaHaitiHeavily indebted poor countries (HIPC)High incomeHondurasHong Kong SAR, ChinaHungaryIBRD onlyIcelandIDA & IBRD totalIDA blendIDA onlyIDA totalIndiaIndonesiaIran, Islamic Rep.IraqIrelandIsraelItalyJamaicaJapanJordanKazakhstanKenyaKiribatiKorea, Rep.KosovoKuwaitKyrgyz RepublicLao PDRLate-demographic dividendLatin America & Caribbean Latin America & Caribbean (excluding high income)Latin America & the Caribbean (IDA & IBRD countries)LatviaLeast developed countries: UN classificationLebanonLesothoLiberiaLibyaLithuaniaLow & middle incomeLow incomeLower middle incomeLuxembourgMacao SAR, ChinaMacedonia, FYRMadagascarMalawiMalaysiaMaldivesMaliMaltaMarshall IslandsMauritaniaMauritiusMexicoMicronesia, Fed. Sts.Middle East & North AfricaMiddle East & North Africa (excluding high income)Middle East & North Africa (IDA & IBRD countries)Middle incomeMoldovaMongoliaMontenegroMoroccoMozambiqueMyanmarNamibiaNauruNepalNetherlandsNew ZealandNicaraguaNigerNigeriaNorth AmericaNorwayOECD membersOmanOther small statesPacific island small statesPakistanPalauPanamaPapua New GuineaParaguayPeruPhilippinesPolandPortugalPost-demographic dividendPre-demographic dividendPuerto RicoQatarRomaniaRussian FederationRwandaSamoaSao Tome and PrincipeSaudi ArabiaSenegalSerbiaSeychellesSierra LeoneSingaporeSint Maarten (Dutch part)Slovak RepublicSloveniaSmall statesSolomon IslandsSouth AfricaSouth AsiaSouth Asia (IDA & IBRD)South SudanSpainSri LankaSt. Kitts and NevisSt. LuciaSt. Vincent and the GrenadinesSub-Saharan Africa Sub-Saharan Africa (excluding high income)Sub-Saharan Africa (IDA & IBRD countries)SudanSurinameSwazilandSwedenSwitzerlandTajikistanTanzaniaThailandTimor-LesteTogoTongaTrinidad and TobagoTunisiaTurkeyTurkmenistanTuvaluUgandaUkraineUnited Arab EmiratesUnited KingdomUnited StatesUpper middle incomeUruguayUzbekistanVanuatuVenezuela, RBVietnamWest Bank and GazaWorldYemen, Rep.ZambiaZimbabwe Timeline:
This timeline shows a graph from 1991 to 2016 of Fragile and conflict affected situations. No data until 1990. Number of actual observations by date: 26.
Source name:
World Development Indicators
Source organization:
World Bank, International Comparison Program database.
Categories, topics:
Economy & Growth
Last updated:
apr 23, 2017
Indicators value changes by year
Minimum:
381.621 bln
jan 1, 1992
Maximum:
1.947 trl
jan 1, 2016
At the date of observation
Value
Absolute change
Change from previous value
jan 1, 1991
475.739 bln
+475.739 bln
0.0%
jan 1, 1992
381.621 bln
-94.119 bln
-19.78%
jan 1, 1993
417.443 bln
+35.823 bln
9.39%
jan 1, 1994
460.181 bln
+42.737 bln
10.24%
jan 1, 1995
488.46 bln
+28.279 bln
6.15%
jan 1, 1996
516.542 bln
+28.082 bln
5.75%
jan 1, 1997
561.447 bln
+44.904 bln
8.69%
jan 1, 1998
620.128 bln
+58.682 bln
10.45%
jan 1, 1999
709.975 bln
+89.847 bln
14.49%
jan 1, 2000
780.072 bln
+70.096 bln
9.87%
jan 1, 2001
817.284 bln
+37.212 bln
4.77%
jan 1, 2002
861.591 bln
+44.307 bln
5.42%
jan 1, 2003
868.013 bln
+6.423 bln
0.75%
jan 1, 2004
838.21 bln
-29.804 bln
-3.43%
jan 1, 2005
993.602 bln
+155.392 bln
18.54%
jan 1, 2006
1.094 trl
+100.812 bln
10.15%
jan 1, 2007
1.207 trl
+112.578 bln
10.29%
jan 1, 2008
1.307 trl
+100.254 bln
8.31%
jan 1, 2009
1.409 trl
+102.169 bln
7.82%
jan 1, 2010
1.485 trl
+75.862 bln
5.38%
jan 1, 2011
1.595 trl
+110.138 bln
7.42%
jan 1, 2012
1.543 trl
-52.201 bln
-3.27%
jan 1, 2013
1.678 trl
+134.558 bln
8.72%
jan 1, 2014
1.803 trl
+124.842 bln
7.44%
jan 1, 2015
1.89 trl
+87.626 bln
4.86%
jan 1, 2016
1.947 trl
+56.329 bln
2.98%
Ranking of countries by current statistics by years


Comments: