29
/
en
AIzaSyAYiBZKx7MnpbEhh9jyipgxe19OcubqV5w
April 1, 2024
127355
Equatorial Guinea
GNQ
true
2
1
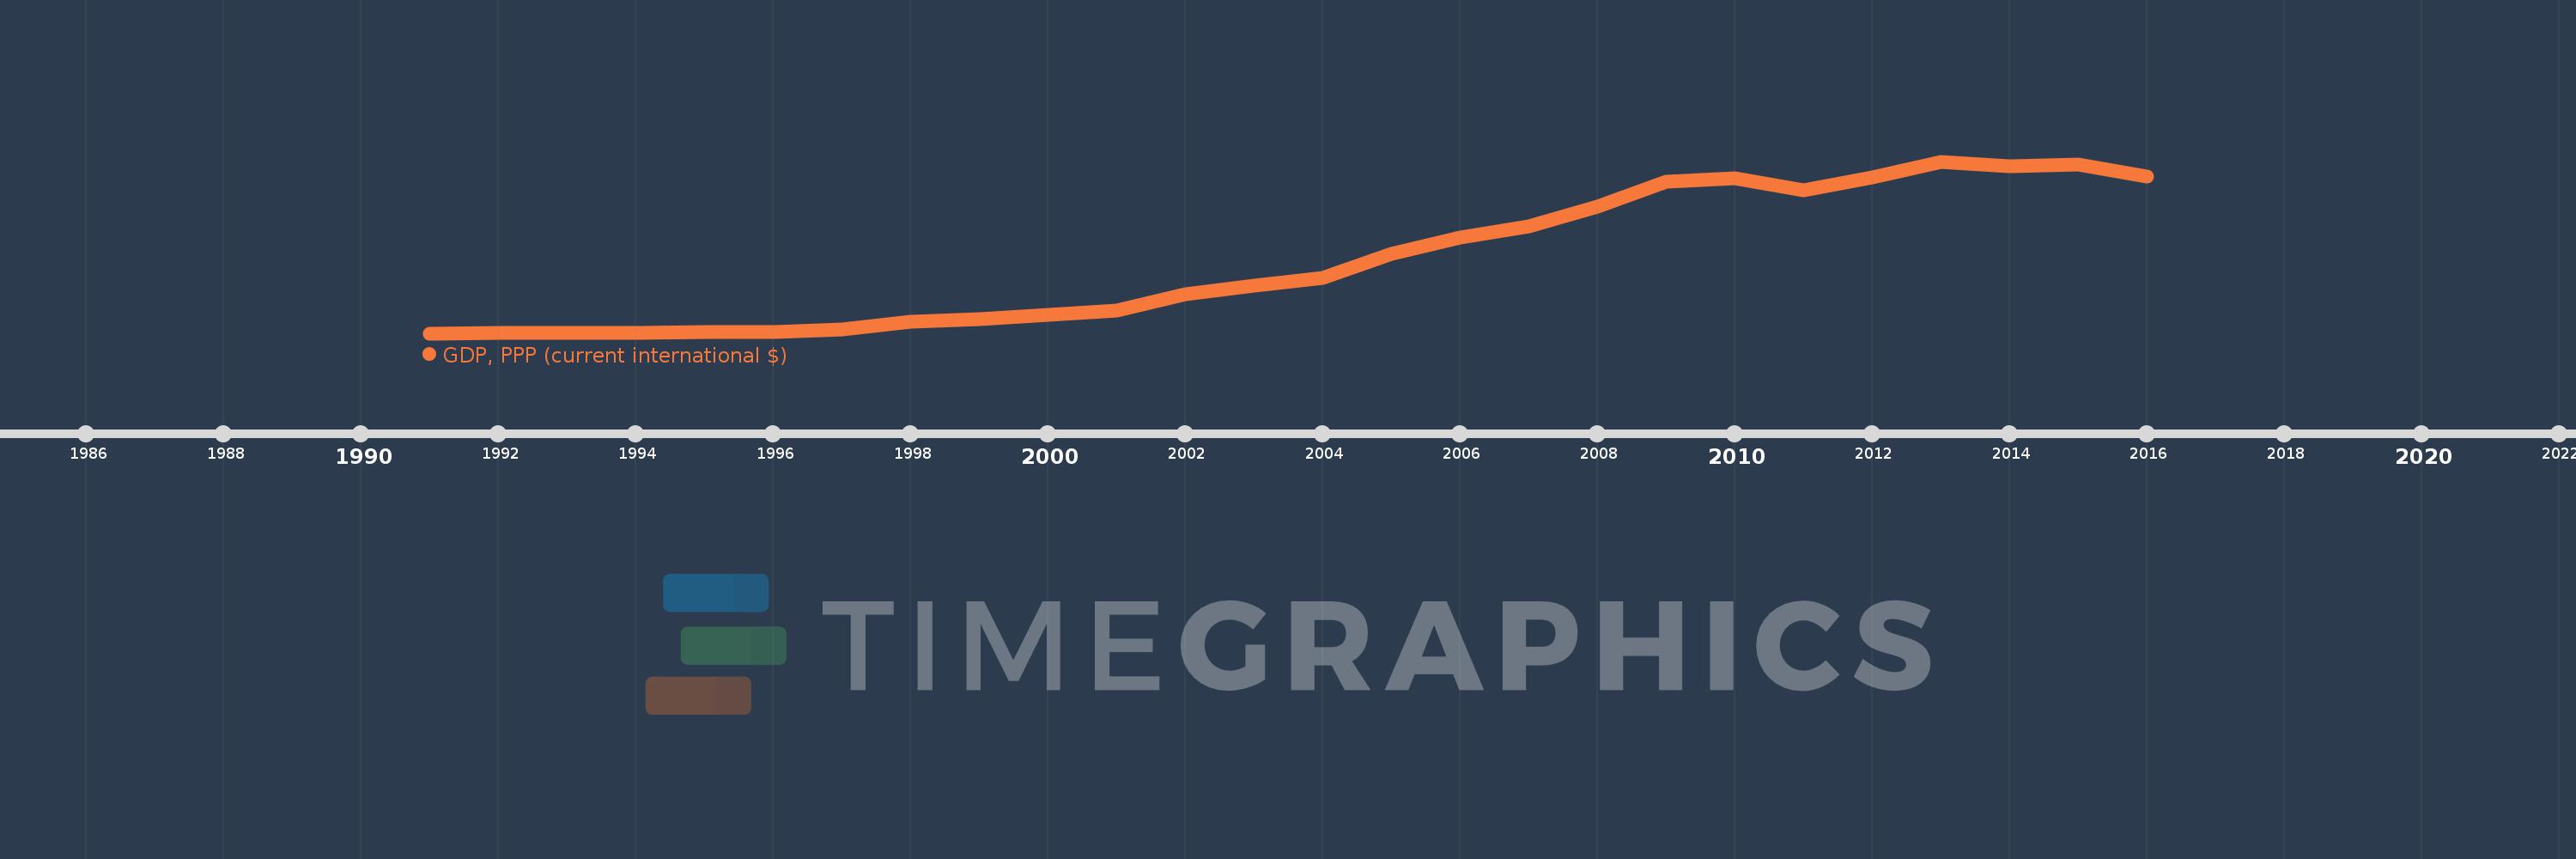
GDP, PPP (current international $)
2016,2015,2014,2013,2012,2011,2010,2009,2008,2007,2006,2005,2004,2003,2002,2001,2000,1999,1998,1997,1996,1995,1994,1993,1992,1991
This statistics in other country:
AfghanistanAlbaniaAlgeriaAngolaAntigua and BarbudaArab WorldArgentinaArmeniaArubaAustraliaAustriaAzerbaijanBahamas, TheBahrainBangladeshBarbadosBelarusBelgiumBelizeBeninBermudaBhutanBoliviaBosnia and HerzegovinaBotswanaBrazilBrunei DarussalamBulgariaBurkina FasoBurundiCabo VerdeCambodiaCameroonCanadaCaribbean small statesCayman IslandsCentral African RepublicCentral Europe and the BalticsChadChileChinaColombiaComorosCongo, Dem. Rep.Congo, Rep.Costa RicaCote d'IvoireCroatiaCubaCyprusCzech RepublicDenmarkDjiboutiDominicaDominican RepublicEarly-demographic dividendEast Asia & PacificEast Asia & Pacific (excluding high income)East Asia & Pacific (IDA & IBRD countries)EcuadorEgypt, Arab Rep.El SalvadorEquatorial GuineaEritreaEstoniaEthiopiaEuro areaEurope & Central AsiaEurope & Central Asia (excluding high income)Europe & Central Asia (IDA & IBRD countries)European UnionFijiFinlandFragile and conflict affected situationsFranceGabonGambia, TheGeorgiaGermanyGhanaGreeceGrenadaGuatemalaGuineaGuinea-BissauGuyanaHaitiHeavily indebted poor countries (HIPC)High incomeHondurasHong Kong SAR, ChinaHungaryIBRD onlyIcelandIDA & IBRD totalIDA blendIDA onlyIDA totalIndiaIndonesiaIran, Islamic Rep.IraqIrelandIsraelItalyJamaicaJapanJordanKazakhstanKenyaKiribatiKorea, Rep.KosovoKuwaitKyrgyz RepublicLao PDRLate-demographic dividendLatin America & Caribbean Latin America & Caribbean (excluding high income)Latin America & the Caribbean (IDA & IBRD countries)LatviaLeast developed countries: UN classificationLebanonLesothoLiberiaLibyaLithuaniaLow & middle incomeLow incomeLower middle incomeLuxembourgMacao SAR, ChinaMacedonia, FYRMadagascarMalawiMalaysiaMaldivesMaliMaltaMarshall IslandsMauritaniaMauritiusMexicoMicronesia, Fed. Sts.Middle East & North AfricaMiddle East & North Africa (excluding high income)Middle East & North Africa (IDA & IBRD countries)Middle incomeMoldovaMongoliaMontenegroMoroccoMozambiqueMyanmarNamibiaNauruNepalNetherlandsNew ZealandNicaraguaNigerNigeriaNorth AmericaNorwayOECD membersOmanOther small statesPacific island small statesPakistanPalauPanamaPapua New GuineaParaguayPeruPhilippinesPolandPortugalPost-demographic dividendPre-demographic dividendPuerto RicoQatarRomaniaRussian FederationRwandaSamoaSao Tome and PrincipeSaudi ArabiaSenegalSerbiaSeychellesSierra LeoneSingaporeSint Maarten (Dutch part)Slovak RepublicSloveniaSmall statesSolomon IslandsSouth AfricaSouth AsiaSouth Asia (IDA & IBRD)South SudanSpainSri LankaSt. Kitts and NevisSt. LuciaSt. Vincent and the GrenadinesSub-Saharan Africa Sub-Saharan Africa (excluding high income)Sub-Saharan Africa (IDA & IBRD countries)SudanSurinameSwazilandSwedenSwitzerlandTajikistanTanzaniaThailandTimor-LesteTogoTongaTrinidad and TobagoTunisiaTurkeyTurkmenistanTuvaluUgandaUkraineUnited Arab EmiratesUnited KingdomUnited StatesUpper middle incomeUruguayUzbekistanVanuatuVenezuela, RBVietnamWest Bank and GazaWorldYemen, Rep.ZambiaZimbabwe Timeline:
This timeline shows a graph from 1991 to 2016 of Equatorial Guinea. No data until 1990. Number of actual observations by date: 26.
Source name:
World Development Indicators
Source organization:
World Bank, International Comparison Program database.
Categories, topics:
Economy & Growth
Last updated:
apr 23, 2017
Indicators value changes by year
Minimum:
275.748 mln
jan 1, 1991
Maximum:
37.689 bln
jan 1, 2013
At the date of observation
Value
Absolute change
Change from previous value
jan 1, 1991
275.748 mln
+275.748 mln
0.0%
jan 1, 1992
282.014 mln
+6.266 mln
2.27%
jan 1, 1993
388.663 mln
+106.649 mln
37.82%
jan 1, 1994
441.812 mln
+53.15 mln
13.67%
jan 1, 1995
526.427 mln
+84.615 mln
19.15%
jan 1, 1996
631.378 mln
+104.952 mln
19.94%
jan 1, 1997
1.071 bln
+439.572 mln
69.62%
jan 1, 1998
2.723 bln
+1.652 bln
154.25%
jan 1, 1999
3.407 bln
+683.932 mln
25.12%
jan 1, 2000
4.347 bln
+939.847 mln
27.59%
jan 1, 2001
5.255 bln
+908.62 mln
20.9%
jan 1, 2002
8.782 bln
+3.526 bln
67.1%
jan 1, 2003
10.652 bln
+1.87 bln
21.3%
jan 1, 2004
12.381 bln
+1.729 bln
16.23%
jan 1, 2005
17.555 bln
+5.174 bln
41.79%
jan 1, 2006
21.154 bln
+3.6 bln
20.51%
jan 1, 2007
23.484 bln
+2.33 bln
11.01%
jan 1, 2008
27.794 bln
+4.309 bln
18.35%
jan 1, 2009
33.383 bln
+5.589 bln
20.11%
jan 1, 2010
34.089 bln
+705.384 mln
2.11%
jan 1, 2011
31.426 bln
-2.663 bln
-7.81%
jan 1, 2012
34.167 bln
+2.741 bln
8.72%
jan 1, 2013
37.689 bln
+3.522 bln
10.31%
jan 1, 2014
36.715 bln
-974.234 mln
-2.58%
jan 1, 2015
37.119 bln
+404.207 mln
1.1%
jan 1, 2016
34.41 bln
-2.709 bln
-7.3%
Ranking of countries by current statistics by years


Comments: