29
/
en
AIzaSyAYiBZKx7MnpbEhh9jyipgxe19OcubqV5w
April 1, 2024
24897
Caribbean small states
CSS
false
2
1
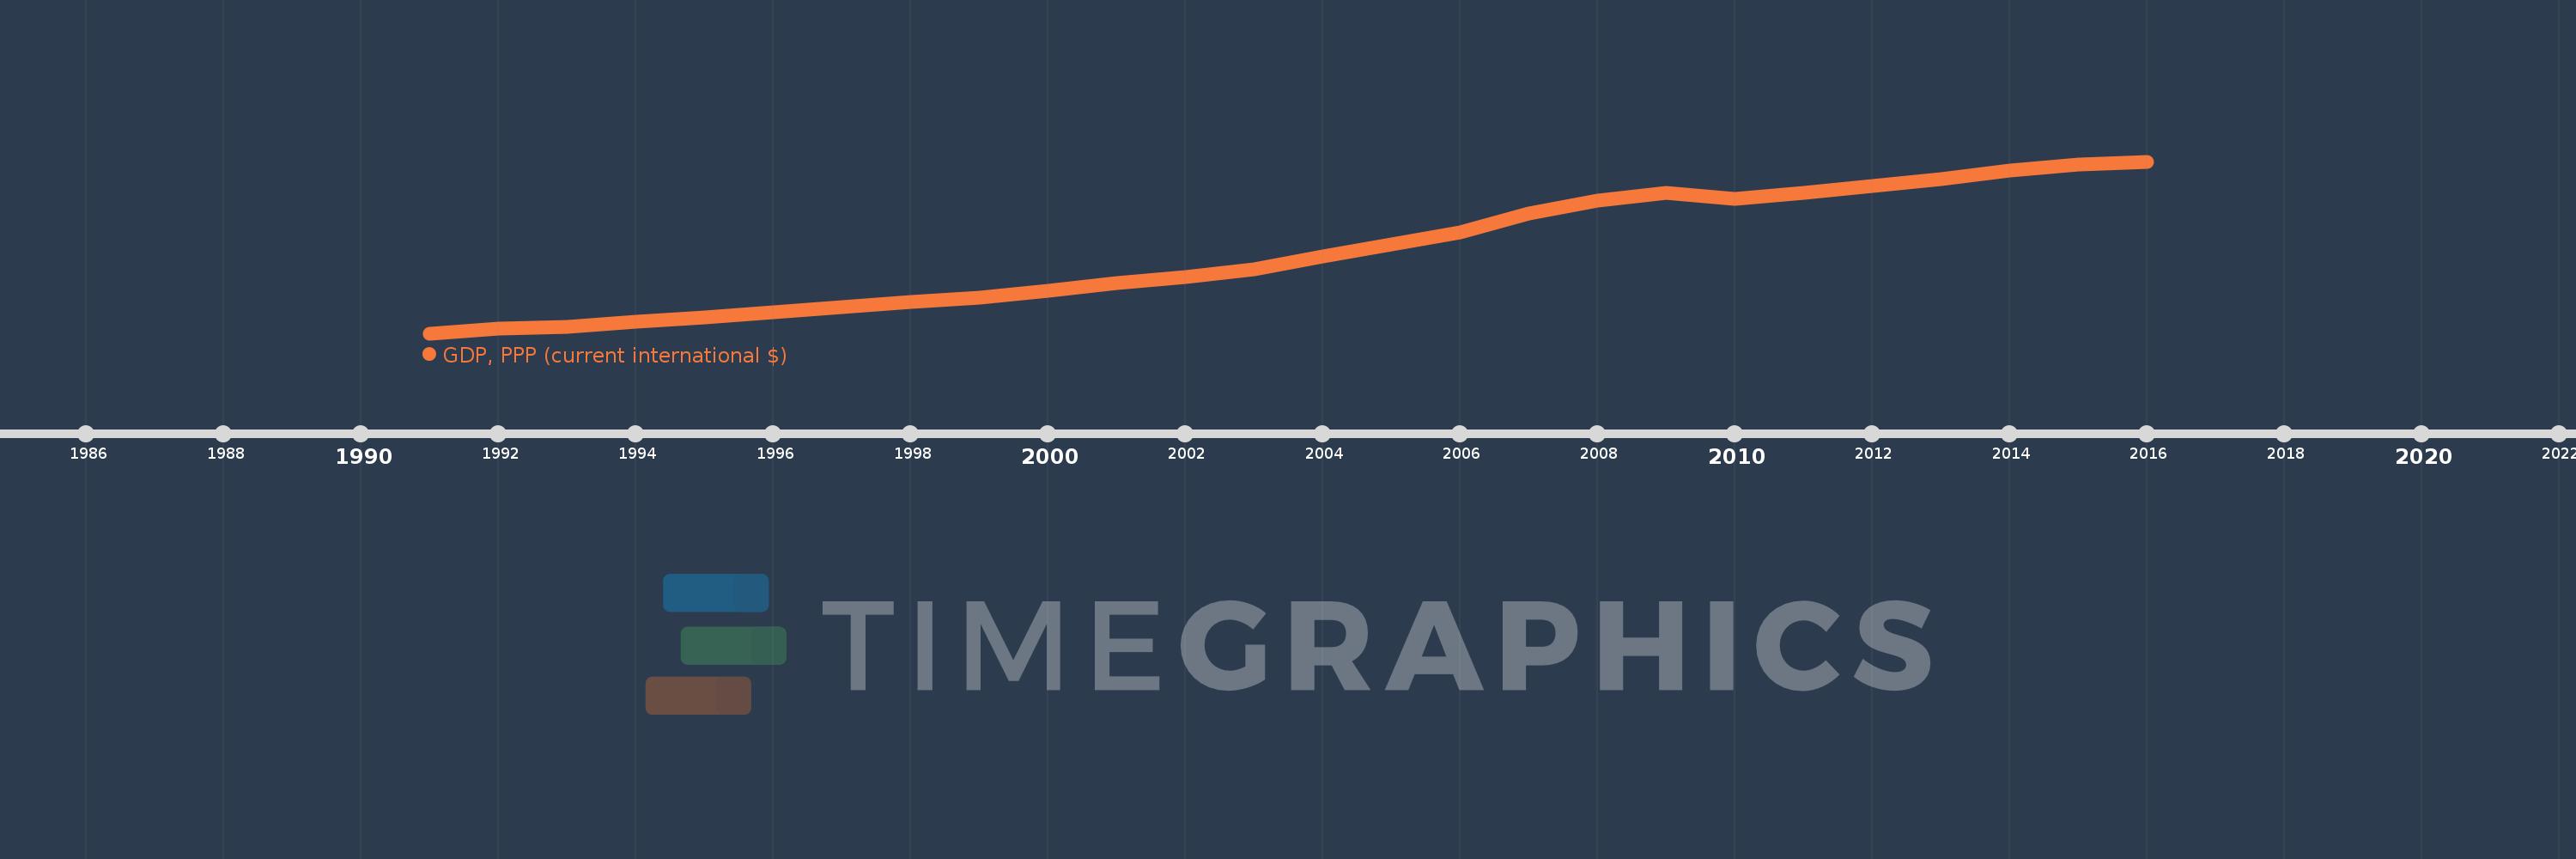
GDP, PPP (current international $)
2016,2015,2014,2013,2012,2011,2010,2009,2008,2007,2006,2005,2004,2003,2002,2001,2000,1999,1998,1997,1996,1995,1994,1993,1992,1991
This statistics in other country:
AfghanistanAlbaniaAlgeriaAngolaAntigua and BarbudaArab WorldArgentinaArmeniaArubaAustraliaAustriaAzerbaijanBahamas, TheBahrainBangladeshBarbadosBelarusBelgiumBelizeBeninBermudaBhutanBoliviaBosnia and HerzegovinaBotswanaBrazilBrunei DarussalamBulgariaBurkina FasoBurundiCabo VerdeCambodiaCameroonCanadaCaribbean small statesCayman IslandsCentral African RepublicCentral Europe and the BalticsChadChileChinaColombiaComorosCongo, Dem. Rep.Congo, Rep.Costa RicaCote d'IvoireCroatiaCubaCyprusCzech RepublicDenmarkDjiboutiDominicaDominican RepublicEarly-demographic dividendEast Asia & PacificEast Asia & Pacific (excluding high income)East Asia & Pacific (IDA & IBRD countries)EcuadorEgypt, Arab Rep.El SalvadorEquatorial GuineaEritreaEstoniaEthiopiaEuro areaEurope & Central AsiaEurope & Central Asia (excluding high income)Europe & Central Asia (IDA & IBRD countries)European UnionFijiFinlandFragile and conflict affected situationsFranceGabonGambia, TheGeorgiaGermanyGhanaGreeceGrenadaGuatemalaGuineaGuinea-BissauGuyanaHaitiHeavily indebted poor countries (HIPC)High incomeHondurasHong Kong SAR, ChinaHungaryIBRD onlyIcelandIDA & IBRD totalIDA blendIDA onlyIDA totalIndiaIndonesiaIran, Islamic Rep.IraqIrelandIsraelItalyJamaicaJapanJordanKazakhstanKenyaKiribatiKorea, Rep.KosovoKuwaitKyrgyz RepublicLao PDRLate-demographic dividendLatin America & Caribbean Latin America & Caribbean (excluding high income)Latin America & the Caribbean (IDA & IBRD countries)LatviaLeast developed countries: UN classificationLebanonLesothoLiberiaLibyaLithuaniaLow & middle incomeLow incomeLower middle incomeLuxembourgMacao SAR, ChinaMacedonia, FYRMadagascarMalawiMalaysiaMaldivesMaliMaltaMarshall IslandsMauritaniaMauritiusMexicoMicronesia, Fed. Sts.Middle East & North AfricaMiddle East & North Africa (excluding high income)Middle East & North Africa (IDA & IBRD countries)Middle incomeMoldovaMongoliaMontenegroMoroccoMozambiqueMyanmarNamibiaNauruNepalNetherlandsNew ZealandNicaraguaNigerNigeriaNorth AmericaNorwayOECD membersOmanOther small statesPacific island small statesPakistanPalauPanamaPapua New GuineaParaguayPeruPhilippinesPolandPortugalPost-demographic dividendPre-demographic dividendPuerto RicoQatarRomaniaRussian FederationRwandaSamoaSao Tome and PrincipeSaudi ArabiaSenegalSerbiaSeychellesSierra LeoneSingaporeSint Maarten (Dutch part)Slovak RepublicSloveniaSmall statesSolomon IslandsSouth AfricaSouth AsiaSouth Asia (IDA & IBRD)South SudanSpainSri LankaSt. Kitts and NevisSt. LuciaSt. Vincent and the GrenadinesSub-Saharan Africa Sub-Saharan Africa (excluding high income)Sub-Saharan Africa (IDA & IBRD countries)SudanSurinameSwazilandSwedenSwitzerlandTajikistanTanzaniaThailandTimor-LesteTogoTongaTrinidad and TobagoTunisiaTurkeyTurkmenistanTuvaluUgandaUkraineUnited Arab EmiratesUnited KingdomUnited StatesUpper middle incomeUruguayUzbekistanVanuatuVenezuela, RBVietnamWest Bank and GazaWorldYemen, Rep.ZambiaZimbabwe Timeline:
This timeline shows a graph from 1991 to 2016 of Caribbean small states. No data until 1990. Number of actual observations by date: 26.
Source name:
World Development Indicators
Source organization:
World Bank, International Comparison Program database.
Categories, topics:
Economy & Growth
Last updated:
apr 23, 2017
Indicators value changes by year
Minimum:
35.074 bln
jan 1, 1991
Maximum:
110.556 bln
jan 1, 2016
At the date of observation
Value
Absolute change
Change from previous value
jan 1, 1991
35.074 bln
+35.074 bln
0.0%
jan 1, 1992
37.092 bln
+2.018 bln
5.75%
jan 1, 1993
38.037 bln
+944.656 mln
2.55%
jan 1, 1994
40.131 bln
+2.094 bln
5.51%
jan 1, 1995
42.101 bln
+1.97 bln
4.91%
jan 1, 1996
44.242 bln
+2.141 bln
5.09%
jan 1, 1997
46.571 bln
+2.329 bln
5.26%
jan 1, 1998
48.92 bln
+2.349 bln
5.04%
jan 1, 1999
50.8 bln
+1.879 bln
3.84%
jan 1, 2000
53.7 bln
+2.9 bln
5.71%
jan 1, 2001
57.022 bln
+3.323 bln
6.19%
jan 1, 2002
59.681 bln
+2.659 bln
4.66%
jan 1, 2003
63.119 bln
+3.438 bln
5.76%
jan 1, 2004
68.86 bln
+5.741 bln
9.1%
jan 1, 2005
74.044 bln
+5.184 bln
7.53%
jan 1, 2006
79.308 bln
+5.264 bln
7.11%
jan 1, 2007
87.841 bln
+8.532 bln
10.76%
jan 1, 2008
93.307 bln
+5.466 bln
6.22%
jan 1, 2009
96.736 bln
+3.429 bln
3.67%
jan 1, 2010
94.107 bln
-2.629 bln
-2.72%
jan 1, 2011
96.76 bln
+2.652 bln
2.82%
jan 1, 2012
99.795 bln
+3.036 bln
3.14%
jan 1, 2013
102.908 bln
+3.112 bln
3.12%
jan 1, 2014
106.498 bln
+3.591 bln
3.49%
jan 1, 2015
109.068 bln
+2.569 bln
2.41%
jan 1, 2016
110.556 bln
+1.488 bln
1.36%
Ranking of countries by current statistics by years


Comments: