29
/
en
AIzaSyAYiBZKx7MnpbEhh9jyipgxe19OcubqV5w
April 1, 2024
270515
Turkmenistan
TKM
true
2
1
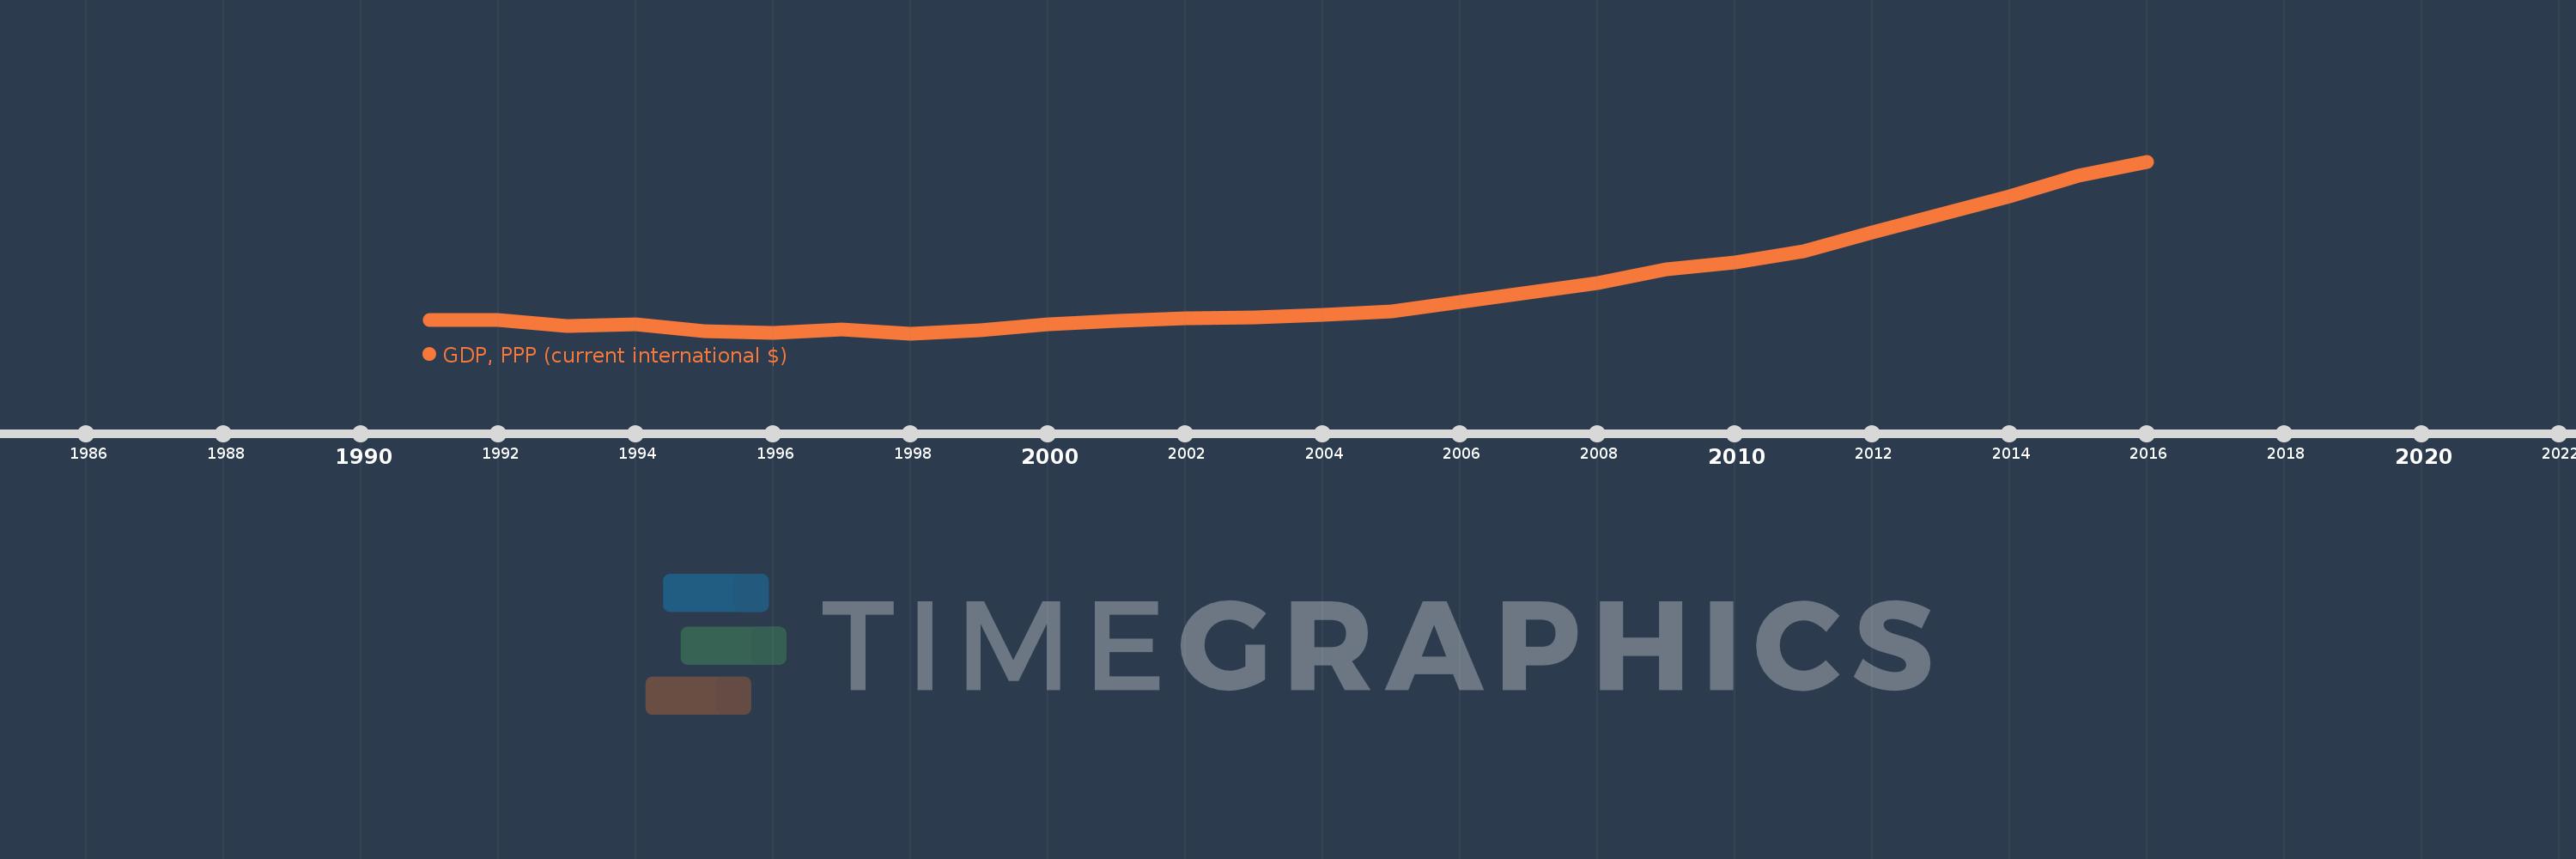
GDP, PPP (current international $)
2016,2015,2014,2013,2012,2011,2010,2009,2008,2007,2006,2005,2004,2003,2002,2001,2000,1999,1998,1997,1996,1995,1994,1993,1992,1991
This statistics in other country:
AfghanistanAlbaniaAlgeriaAngolaAntigua and BarbudaArab WorldArgentinaArmeniaArubaAustraliaAustriaAzerbaijanBahamas, TheBahrainBangladeshBarbadosBelarusBelgiumBelizeBeninBermudaBhutanBoliviaBosnia and HerzegovinaBotswanaBrazilBrunei DarussalamBulgariaBurkina FasoBurundiCabo VerdeCambodiaCameroonCanadaCaribbean small statesCayman IslandsCentral African RepublicCentral Europe and the BalticsChadChileChinaColombiaComorosCongo, Dem. Rep.Congo, Rep.Costa RicaCote d'IvoireCroatiaCubaCyprusCzech RepublicDenmarkDjiboutiDominicaDominican RepublicEarly-demographic dividendEast Asia & PacificEast Asia & Pacific (excluding high income)East Asia & Pacific (IDA & IBRD countries)EcuadorEgypt, Arab Rep.El SalvadorEquatorial GuineaEritreaEstoniaEthiopiaEuro areaEurope & Central AsiaEurope & Central Asia (excluding high income)Europe & Central Asia (IDA & IBRD countries)European UnionFijiFinlandFragile and conflict affected situationsFranceGabonGambia, TheGeorgiaGermanyGhanaGreeceGrenadaGuatemalaGuineaGuinea-BissauGuyanaHaitiHeavily indebted poor countries (HIPC)High incomeHondurasHong Kong SAR, ChinaHungaryIBRD onlyIcelandIDA & IBRD totalIDA blendIDA onlyIDA totalIndiaIndonesiaIran, Islamic Rep.IraqIrelandIsraelItalyJamaicaJapanJordanKazakhstanKenyaKiribatiKorea, Rep.KosovoKuwaitKyrgyz RepublicLao PDRLate-demographic dividendLatin America & Caribbean Latin America & Caribbean (excluding high income)Latin America & the Caribbean (IDA & IBRD countries)LatviaLeast developed countries: UN classificationLebanonLesothoLiberiaLibyaLithuaniaLow & middle incomeLow incomeLower middle incomeLuxembourgMacao SAR, ChinaMacedonia, FYRMadagascarMalawiMalaysiaMaldivesMaliMaltaMarshall IslandsMauritaniaMauritiusMexicoMicronesia, Fed. Sts.Middle East & North AfricaMiddle East & North Africa (excluding high income)Middle East & North Africa (IDA & IBRD countries)Middle incomeMoldovaMongoliaMontenegroMoroccoMozambiqueMyanmarNamibiaNauruNepalNetherlandsNew ZealandNicaraguaNigerNigeriaNorth AmericaNorwayOECD membersOmanOther small statesPacific island small statesPakistanPalauPanamaPapua New GuineaParaguayPeruPhilippinesPolandPortugalPost-demographic dividendPre-demographic dividendPuerto RicoQatarRomaniaRussian FederationRwandaSamoaSao Tome and PrincipeSaudi ArabiaSenegalSerbiaSeychellesSierra LeoneSingaporeSint Maarten (Dutch part)Slovak RepublicSloveniaSmall statesSolomon IslandsSouth AfricaSouth AsiaSouth Asia (IDA & IBRD)South SudanSpainSri LankaSt. Kitts and NevisSt. LuciaSt. Vincent and the GrenadinesSub-Saharan Africa Sub-Saharan Africa (excluding high income)Sub-Saharan Africa (IDA & IBRD countries)SudanSurinameSwazilandSwedenSwitzerlandTajikistanTanzaniaThailandTimor-LesteTogoTongaTrinidad and TobagoTunisiaTurkeyTurkmenistanTuvaluUgandaUkraineUnited Arab EmiratesUnited KingdomUnited StatesUpper middle incomeUruguayUzbekistanVanuatuVenezuela, RBVietnamWest Bank and GazaWorldYemen, Rep.ZambiaZimbabwe Timeline:
This timeline shows a graph from 1991 to 2016 of Turkmenistan. No data until 1990. Number of actual observations by date: 26.
Source name:
World Development Indicators
Source organization:
World Bank, International Comparison Program database.
Categories, topics:
Economy & Growth
Last updated:
apr 23, 2017
Indicators value changes by year
Minimum:
13.82 bln
jan 1, 1998
Maximum:
88.837 bln
jan 1, 2016
At the date of observation
Value
Absolute change
Change from previous value
jan 1, 1991
19.803 bln
+19.803 bln
0.0%
jan 1, 1992
19.52 bln
-283.187 mln
-1.43%
jan 1, 1993
16.977 bln
-2.543 bln
-13.03%
jan 1, 1994
17.641 bln
+664.628 mln
3.91%
jan 1, 1995
14.9 bln
-2.741 bln
-15.54%
jan 1, 1996
14.115 bln
-784.407 mln
-5.26%
jan 1, 1997
15.336 bln
+1.221 bln
8.65%
jan 1, 1998
13.82 bln
-1.516 bln
-9.88%
jan 1, 1999
14.962 bln
+1.142 bln
8.26%
jan 1, 2000
17.698 bln
+2.736 bln
18.28%
jan 1, 2001
19.09 bln
+1.393 bln
7.87%
jan 1, 2002
20.374 bln
+1.283 bln
6.72%
jan 1, 2003
20.74 bln
+365.961 mln
1.8%
jan 1, 2004
21.845 bln
+1.105 bln
5.33%
jan 1, 2005
23.568 bln
+1.723 bln
7.89%
jan 1, 2006
27.498 bln
+3.931 bln
16.68%
jan 1, 2007
31.451 bln
+3.953 bln
14.38%
jan 1, 2008
35.859 bln
+4.408 bln
14.01%
jan 1, 2009
41.937 bln
+6.078 bln
16.95%
jan 1, 2010
44.833 bln
+2.896 bln
6.91%
jan 1, 2011
49.556 bln
+4.723 bln
10.53%
jan 1, 2012
58.014 bln
+8.458 bln
17.07%
jan 1, 2013
65.641 bln
+7.627 bln
13.15%
jan 1, 2014
73.505 bln
+7.864 bln
11.98%
jan 1, 2015
82.527 bln
+9.023 bln
12.27%
jan 1, 2016
88.837 bln
+6.31 bln
7.65%
Ranking of countries by current statistics by years


Comments: