29
/
en
AIzaSyAYiBZKx7MnpbEhh9jyipgxe19OcubqV5w
April 1, 2024
284656
Yemen, Rep.
YEM
true
2
1
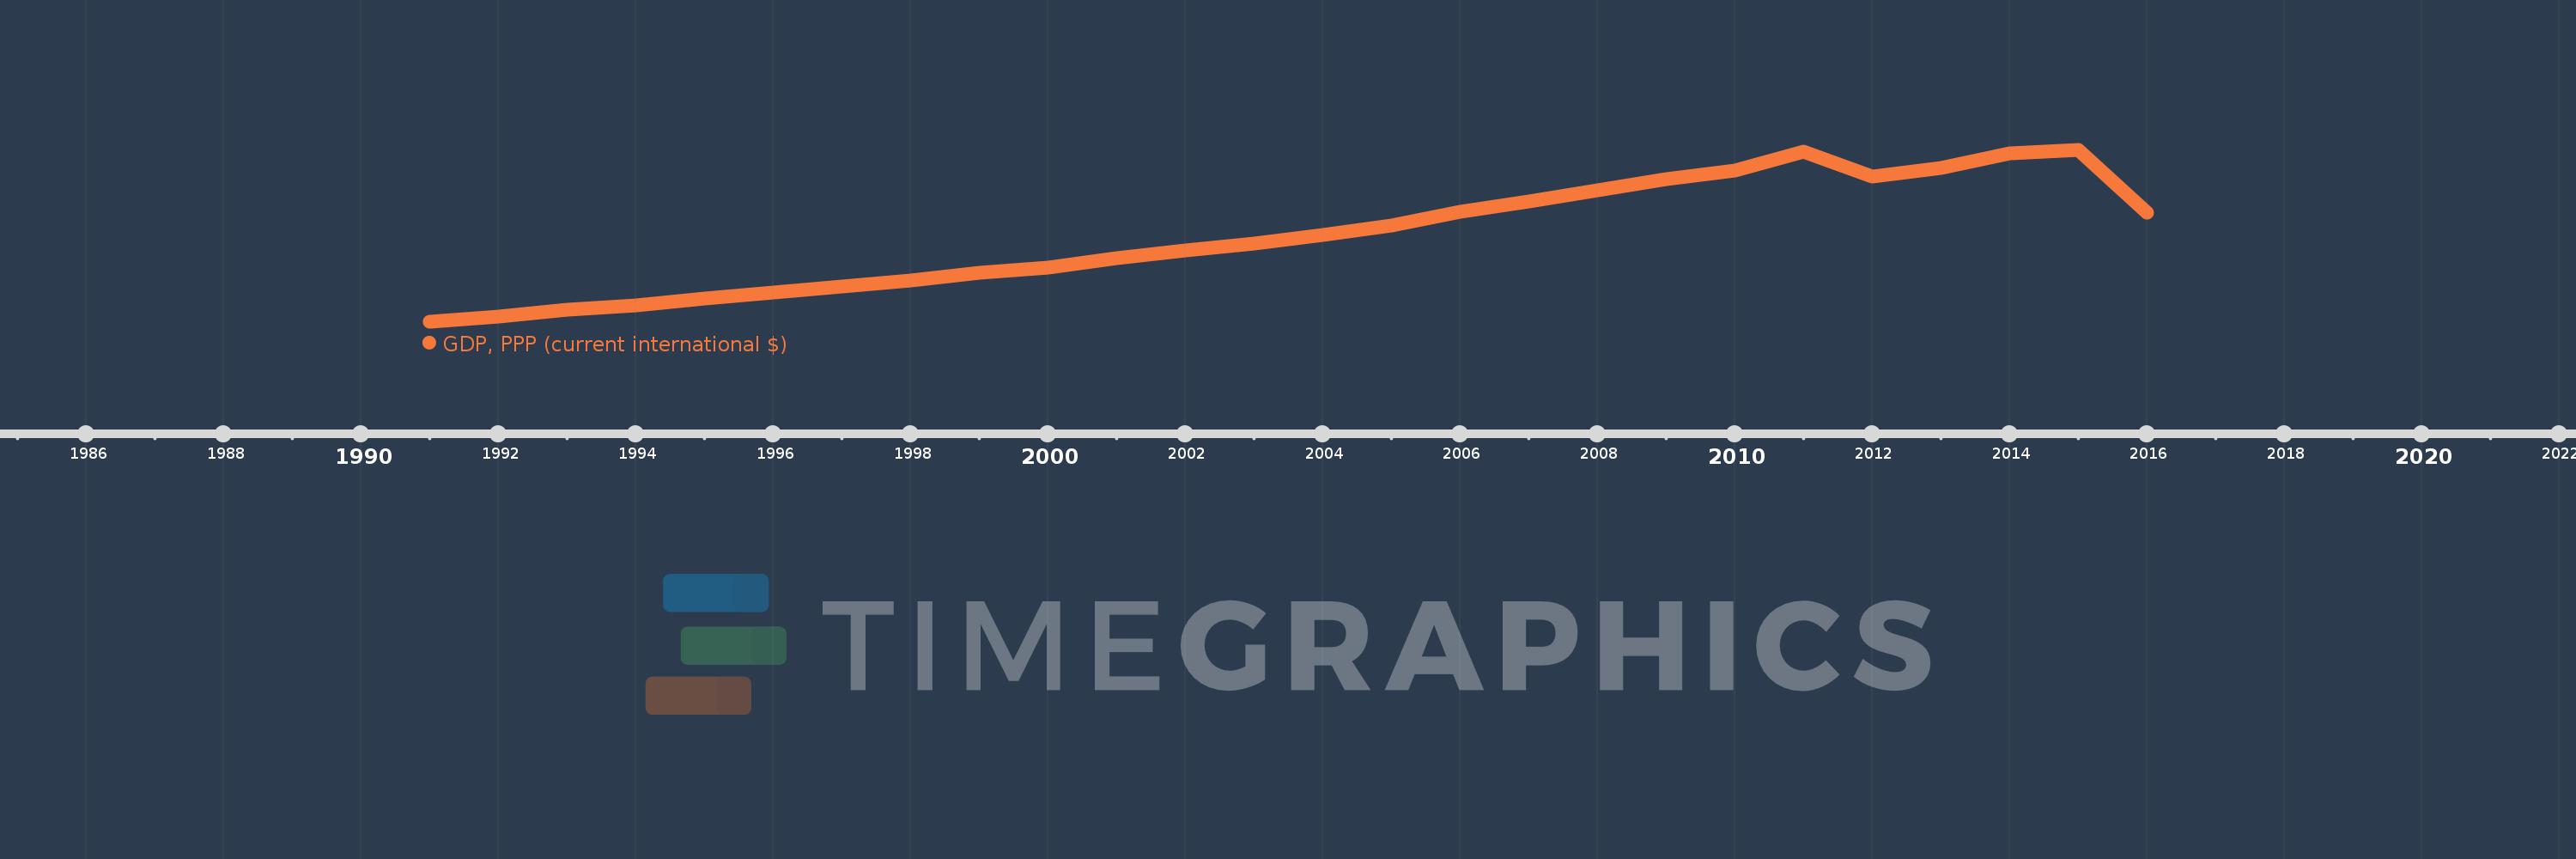
GDP, PPP (current international $)
2016,2015,2014,2013,2012,2011,2010,2009,2008,2007,2006,2005,2004,2003,2002,2001,2000,1999,1998,1997,1996,1995,1994,1993,1992,1991
This statistics in other country:
AfghanistanAlbaniaAlgeriaAngolaAntigua and BarbudaArab WorldArgentinaArmeniaArubaAustraliaAustriaAzerbaijanBahamas, TheBahrainBangladeshBarbadosBelarusBelgiumBelizeBeninBermudaBhutanBoliviaBosnia and HerzegovinaBotswanaBrazilBrunei DarussalamBulgariaBurkina FasoBurundiCabo VerdeCambodiaCameroonCanadaCaribbean small statesCayman IslandsCentral African RepublicCentral Europe and the BalticsChadChileChinaColombiaComorosCongo, Dem. Rep.Congo, Rep.Costa RicaCote d'IvoireCroatiaCubaCyprusCzech RepublicDenmarkDjiboutiDominicaDominican RepublicEarly-demographic dividendEast Asia & PacificEast Asia & Pacific (excluding high income)East Asia & Pacific (IDA & IBRD countries)EcuadorEgypt, Arab Rep.El SalvadorEquatorial GuineaEritreaEstoniaEthiopiaEuro areaEurope & Central AsiaEurope & Central Asia (excluding high income)Europe & Central Asia (IDA & IBRD countries)European UnionFijiFinlandFragile and conflict affected situationsFranceGabonGambia, TheGeorgiaGermanyGhanaGreeceGrenadaGuatemalaGuineaGuinea-BissauGuyanaHaitiHeavily indebted poor countries (HIPC)High incomeHondurasHong Kong SAR, ChinaHungaryIBRD onlyIcelandIDA & IBRD totalIDA blendIDA onlyIDA totalIndiaIndonesiaIran, Islamic Rep.IraqIrelandIsraelItalyJamaicaJapanJordanKazakhstanKenyaKiribatiKorea, Rep.KosovoKuwaitKyrgyz RepublicLao PDRLate-demographic dividendLatin America & Caribbean Latin America & Caribbean (excluding high income)Latin America & the Caribbean (IDA & IBRD countries)LatviaLeast developed countries: UN classificationLebanonLesothoLiberiaLibyaLithuaniaLow & middle incomeLow incomeLower middle incomeLuxembourgMacao SAR, ChinaMacedonia, FYRMadagascarMalawiMalaysiaMaldivesMaliMaltaMarshall IslandsMauritaniaMauritiusMexicoMicronesia, Fed. Sts.Middle East & North AfricaMiddle East & North Africa (excluding high income)Middle East & North Africa (IDA & IBRD countries)Middle incomeMoldovaMongoliaMontenegroMoroccoMozambiqueMyanmarNamibiaNauruNepalNetherlandsNew ZealandNicaraguaNigerNigeriaNorth AmericaNorwayOECD membersOmanOther small statesPacific island small statesPakistanPalauPanamaPapua New GuineaParaguayPeruPhilippinesPolandPortugalPost-demographic dividendPre-demographic dividendPuerto RicoQatarRomaniaRussian FederationRwandaSamoaSao Tome and PrincipeSaudi ArabiaSenegalSerbiaSeychellesSierra LeoneSingaporeSint Maarten (Dutch part)Slovak RepublicSloveniaSmall statesSolomon IslandsSouth AfricaSouth AsiaSouth Asia (IDA & IBRD)South SudanSpainSri LankaSt. Kitts and NevisSt. LuciaSt. Vincent and the GrenadinesSub-Saharan Africa Sub-Saharan Africa (excluding high income)Sub-Saharan Africa (IDA & IBRD countries)SudanSurinameSwazilandSwedenSwitzerlandTajikistanTanzaniaThailandTimor-LesteTogoTongaTrinidad and TobagoTunisiaTurkeyTurkmenistanTuvaluUgandaUkraineUnited Arab EmiratesUnited KingdomUnited StatesUpper middle incomeUruguayUzbekistanVanuatuVenezuela, RBVietnamWest Bank and GazaWorldYemen, Rep.ZambiaZimbabwe Timeline:
This timeline shows a graph from 1991 to 2016 of Yemen, Rep.. No data until 1990. Number of actual observations by date: 26.
Source name:
World Development Indicators
Source organization:
World Bank, International Comparison Program database.
Categories, topics:
Economy & Growth
Last updated:
apr 23, 2017
Indicators value changes by year
Minimum:
25.928 bln
jan 1, 1991
Maximum:
104.144 bln
jan 1, 2015
At the date of observation
Value
Absolute change
Change from previous value
jan 1, 1991
25.928 bln
+25.928 bln
0.0%
jan 1, 1992
28.477 bln
+2.549 bln
9.83%
jan 1, 1993
31.516 bln
+3.04 bln
10.67%
jan 1, 1994
33.558 bln
+2.041 bln
6.48%
jan 1, 1995
36.575 bln
+3.018 bln
8.99%
jan 1, 1996
39.455 bln
+2.88 bln
7.87%
jan 1, 1997
42.038 bln
+2.582 bln
6.55%
jan 1, 1998
44.994 bln
+2.956 bln
7.03%
jan 1, 1999
48.214 bln
+3.22 bln
7.16%
jan 1, 2000
50.8 bln
+2.586 bln
5.36%
jan 1, 2001
55.168 bln
+4.368 bln
8.6%
jan 1, 2002
58.571 bln
+3.403 bln
6.17%
jan 1, 2003
61.811 bln
+3.239 bln
5.53%
jan 1, 2004
65.406 bln
+3.595 bln
5.82%
jan 1, 2005
69.874 bln
+4.468 bln
6.83%
jan 1, 2006
76.155 bln
+6.281 bln
8.99%
jan 1, 2007
80.983 bln
+4.828 bln
6.34%
jan 1, 2008
85.914 bln
+4.931 bln
6.09%
jan 1, 2009
90.795 bln
+4.881 bln
5.68%
jan 1, 2010
95.021 bln
+4.227 bln
4.66%
jan 1, 2011
103.59 bln
+8.569 bln
9.02%
jan 1, 2012
92.285 bln
-11.305 bln
-10.91%
jan 1, 2013
96.234 bln
+3.949 bln
4.28%
jan 1, 2014
102.505 bln
+6.271 bln
6.52%
jan 1, 2015
104.144 bln
+1.638 bln
1.6%
jan 1, 2016
75.688 bln
-28.455 bln
-27.32%
Ranking of countries by current statistics by years


Comments: