29
/
en
AIzaSyAYiBZKx7MnpbEhh9jyipgxe19OcubqV5w
April 1, 2024
101095
Canada
CAN
true
2
1
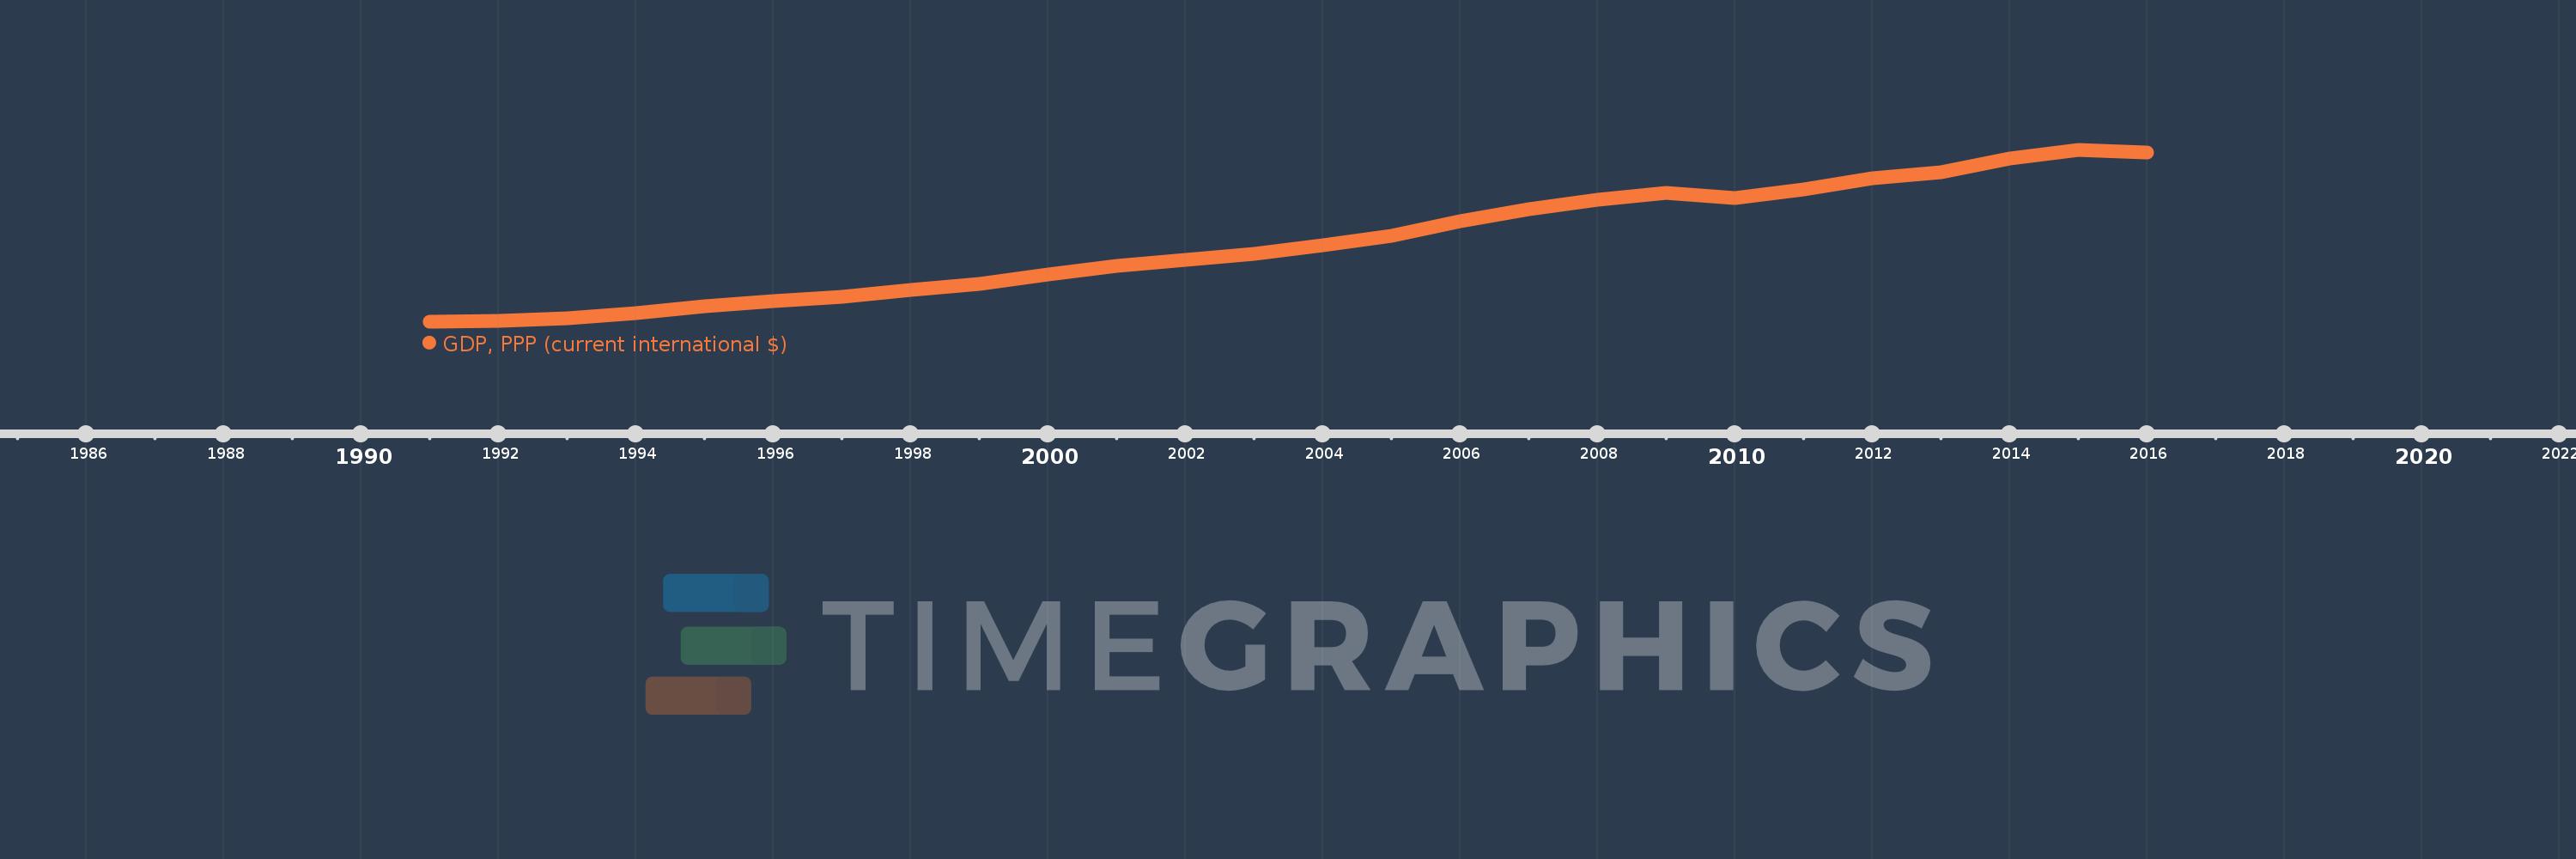
GDP, PPP (current international $)
2016,2015,2014,2013,2012,2011,2010,2009,2008,2007,2006,2005,2004,2003,2002,2001,2000,1999,1998,1997,1996,1995,1994,1993,1992,1991
This statistics in other country:
AfghanistanAlbaniaAlgeriaAngolaAntigua and BarbudaArab WorldArgentinaArmeniaArubaAustraliaAustriaAzerbaijanBahamas, TheBahrainBangladeshBarbadosBelarusBelgiumBelizeBeninBermudaBhutanBoliviaBosnia and HerzegovinaBotswanaBrazilBrunei DarussalamBulgariaBurkina FasoBurundiCabo VerdeCambodiaCameroonCanadaCaribbean small statesCayman IslandsCentral African RepublicCentral Europe and the BalticsChadChileChinaColombiaComorosCongo, Dem. Rep.Congo, Rep.Costa RicaCote d'IvoireCroatiaCubaCyprusCzech RepublicDenmarkDjiboutiDominicaDominican RepublicEarly-demographic dividendEast Asia & PacificEast Asia & Pacific (excluding high income)East Asia & Pacific (IDA & IBRD countries)EcuadorEgypt, Arab Rep.El SalvadorEquatorial GuineaEritreaEstoniaEthiopiaEuro areaEurope & Central AsiaEurope & Central Asia (excluding high income)Europe & Central Asia (IDA & IBRD countries)European UnionFijiFinlandFragile and conflict affected situationsFranceGabonGambia, TheGeorgiaGermanyGhanaGreeceGrenadaGuatemalaGuineaGuinea-BissauGuyanaHaitiHeavily indebted poor countries (HIPC)High incomeHondurasHong Kong SAR, ChinaHungaryIBRD onlyIcelandIDA & IBRD totalIDA blendIDA onlyIDA totalIndiaIndonesiaIran, Islamic Rep.IraqIrelandIsraelItalyJamaicaJapanJordanKazakhstanKenyaKiribatiKorea, Rep.KosovoKuwaitKyrgyz RepublicLao PDRLate-demographic dividendLatin America & Caribbean Latin America & Caribbean (excluding high income)Latin America & the Caribbean (IDA & IBRD countries)LatviaLeast developed countries: UN classificationLebanonLesothoLiberiaLibyaLithuaniaLow & middle incomeLow incomeLower middle incomeLuxembourgMacao SAR, ChinaMacedonia, FYRMadagascarMalawiMalaysiaMaldivesMaliMaltaMarshall IslandsMauritaniaMauritiusMexicoMicronesia, Fed. Sts.Middle East & North AfricaMiddle East & North Africa (excluding high income)Middle East & North Africa (IDA & IBRD countries)Middle incomeMoldovaMongoliaMontenegroMoroccoMozambiqueMyanmarNamibiaNauruNepalNetherlandsNew ZealandNicaraguaNigerNigeriaNorth AmericaNorwayOECD membersOmanOther small statesPacific island small statesPakistanPalauPanamaPapua New GuineaParaguayPeruPhilippinesPolandPortugalPost-demographic dividendPre-demographic dividendPuerto RicoQatarRomaniaRussian FederationRwandaSamoaSao Tome and PrincipeSaudi ArabiaSenegalSerbiaSeychellesSierra LeoneSingaporeSint Maarten (Dutch part)Slovak RepublicSloveniaSmall statesSolomon IslandsSouth AfricaSouth AsiaSouth Asia (IDA & IBRD)South SudanSpainSri LankaSt. Kitts and NevisSt. LuciaSt. Vincent and the GrenadinesSub-Saharan Africa Sub-Saharan Africa (excluding high income)Sub-Saharan Africa (IDA & IBRD countries)SudanSurinameSwazilandSwedenSwitzerlandTajikistanTanzaniaThailandTimor-LesteTogoTongaTrinidad and TobagoTunisiaTurkeyTurkmenistanTuvaluUgandaUkraineUnited Arab EmiratesUnited KingdomUnited StatesUpper middle incomeUruguayUzbekistanVanuatuVenezuela, RBVietnamWest Bank and GazaWorldYemen, Rep.ZambiaZimbabwe Timeline:
This timeline shows a graph from 1991 to 2016 of Canada. No data until 1990. Number of actual observations by date: 26.
Source name:
World Development Indicators
Source organization:
World Bank, International Comparison Program database.
Categories, topics:
Economy & Growth
Last updated:
apr 23, 2017
Indicators value changes by year
Minimum:
558.817 bln
jan 1, 1991
Maximum:
1.596 trl
jan 1, 2015
At the date of observation
Value
Absolute change
Change from previous value
jan 1, 1991
558.817 bln
+558.817 bln
0.0%
jan 1, 1992
565.143 bln
+6.326 bln
1.13%
jan 1, 1993
583.13 bln
+17.987 bln
3.18%
jan 1, 1994
612.856 bln
+29.726 bln
5.1%
jan 1, 1995
654.022 bln
+41.167 bln
6.72%
jan 1, 1996
685.541 bln
+31.519 bln
4.82%
jan 1, 1997
709.302 bln
+23.761 bln
3.47%
jan 1, 1998
752.319 bln
+43.017 bln
6.06%
jan 1, 1999
790.003 bln
+37.684 bln
5.01%
jan 1, 2000
843.507 bln
+53.504 bln
6.77%
jan 1, 2001
898.025 bln
+54.518 bln
6.46%
jan 1, 2002
934.754 bln
+36.73 bln
4.09%
jan 1, 2003
967.559 bln
+32.804 bln
3.51%
jan 1, 2004
1.02 trl
+52.062 bln
5.38%
jan 1, 2005
1.08 trl
+60.366 bln
5.92%
jan 1, 2006
1.168 trl
+87.594 bln
8.11%
jan 1, 2007
1.238 trl
+70.42 bln
6.03%
jan 1, 2008
1.297 trl
+59.164 bln
4.78%
jan 1, 2009
1.339 trl
+41.896 bln
3.23%
jan 1, 2010
1.304 trl
-34.572 bln
-2.58%
jan 1, 2011
1.361 trl
+56.649 bln
4.34%
jan 1, 2012
1.427 trl
+66.33 bln
4.87%
jan 1, 2013
1.465 trl
+37.098 bln
2.6%
jan 1, 2014
1.548 trl
+83.195 bln
5.68%
jan 1, 2015
1.596 trl
+48.092 bln
3.11%
jan 1, 2016
1.584 trl
-11.448 bln
-0.72%
Ranking of countries by current statistics by years


Comments: