29
/
en
AIzaSyAYiBZKx7MnpbEhh9jyipgxe19OcubqV5w
April 1, 2024
75008
Azerbaijan
AZE
true
2
1
GDP, PPP (current international $)
2016,2015,2014,2013,2012,2011,2010,2009,2008,2007,2006,2005,2004,2003,2002,2001,2000,1999,1998,1997,1996,1995,1994,1993,1992,1991
This statistics in other country:
AfghanistanAlbaniaAlgeriaAngolaAntigua and BarbudaArab WorldArgentinaArmeniaArubaAustraliaAustriaAzerbaijanBahamas, TheBahrainBangladeshBarbadosBelarusBelgiumBelizeBeninBermudaBhutanBoliviaBosnia and HerzegovinaBotswanaBrazilBrunei DarussalamBulgariaBurkina FasoBurundiCabo VerdeCambodiaCameroonCanadaCaribbean small statesCayman IslandsCentral African RepublicCentral Europe and the BalticsChadChileChinaColombiaComorosCongo, Dem. Rep.Congo, Rep.Costa RicaCote d'IvoireCroatiaCubaCyprusCzech RepublicDenmarkDjiboutiDominicaDominican RepublicEarly-demographic dividendEast Asia & PacificEast Asia & Pacific (excluding high income)East Asia & Pacific (IDA & IBRD countries)EcuadorEgypt, Arab Rep.El SalvadorEquatorial GuineaEritreaEstoniaEthiopiaEuro areaEurope & Central AsiaEurope & Central Asia (excluding high income)Europe & Central Asia (IDA & IBRD countries)European UnionFijiFinlandFragile and conflict affected situationsFranceGabonGambia, TheGeorgiaGermanyGhanaGreeceGrenadaGuatemalaGuineaGuinea-BissauGuyanaHaitiHeavily indebted poor countries (HIPC)High incomeHondurasHong Kong SAR, ChinaHungaryIBRD onlyIcelandIDA & IBRD totalIDA blendIDA onlyIDA totalIndiaIndonesiaIran, Islamic Rep.IraqIrelandIsraelItalyJamaicaJapanJordanKazakhstanKenyaKiribatiKorea, Rep.KosovoKuwaitKyrgyz RepublicLao PDRLate-demographic dividendLatin America & Caribbean Latin America & Caribbean (excluding high income)Latin America & the Caribbean (IDA & IBRD countries)LatviaLeast developed countries: UN classificationLebanonLesothoLiberiaLibyaLithuaniaLow & middle incomeLow incomeLower middle incomeLuxembourgMacao SAR, ChinaMacedonia, FYRMadagascarMalawiMalaysiaMaldivesMaliMaltaMarshall IslandsMauritaniaMauritiusMexicoMicronesia, Fed. Sts.Middle East & North AfricaMiddle East & North Africa (excluding high income)Middle East & North Africa (IDA & IBRD countries)Middle incomeMoldovaMongoliaMontenegroMoroccoMozambiqueMyanmarNamibiaNauruNepalNetherlandsNew ZealandNicaraguaNigerNigeriaNorth AmericaNorwayOECD membersOmanOther small statesPacific island small statesPakistanPalauPanamaPapua New GuineaParaguayPeruPhilippinesPolandPortugalPost-demographic dividendPre-demographic dividendPuerto RicoQatarRomaniaRussian FederationRwandaSamoaSao Tome and PrincipeSaudi ArabiaSenegalSerbiaSeychellesSierra LeoneSingaporeSint Maarten (Dutch part)Slovak RepublicSloveniaSmall statesSolomon IslandsSouth AfricaSouth AsiaSouth Asia (IDA & IBRD)South SudanSpainSri LankaSt. Kitts and NevisSt. LuciaSt. Vincent and the GrenadinesSub-Saharan Africa Sub-Saharan Africa (excluding high income)Sub-Saharan Africa (IDA & IBRD countries)SudanSurinameSwazilandSwedenSwitzerlandTajikistanTanzaniaThailandTimor-LesteTogoTongaTrinidad and TobagoTunisiaTurkeyTurkmenistanTuvaluUgandaUkraineUnited Arab EmiratesUnited KingdomUnited StatesUpper middle incomeUruguayUzbekistanVanuatuVenezuela, RBVietnamWest Bank and GazaWorldYemen, Rep.ZambiaZimbabwe Timeline:
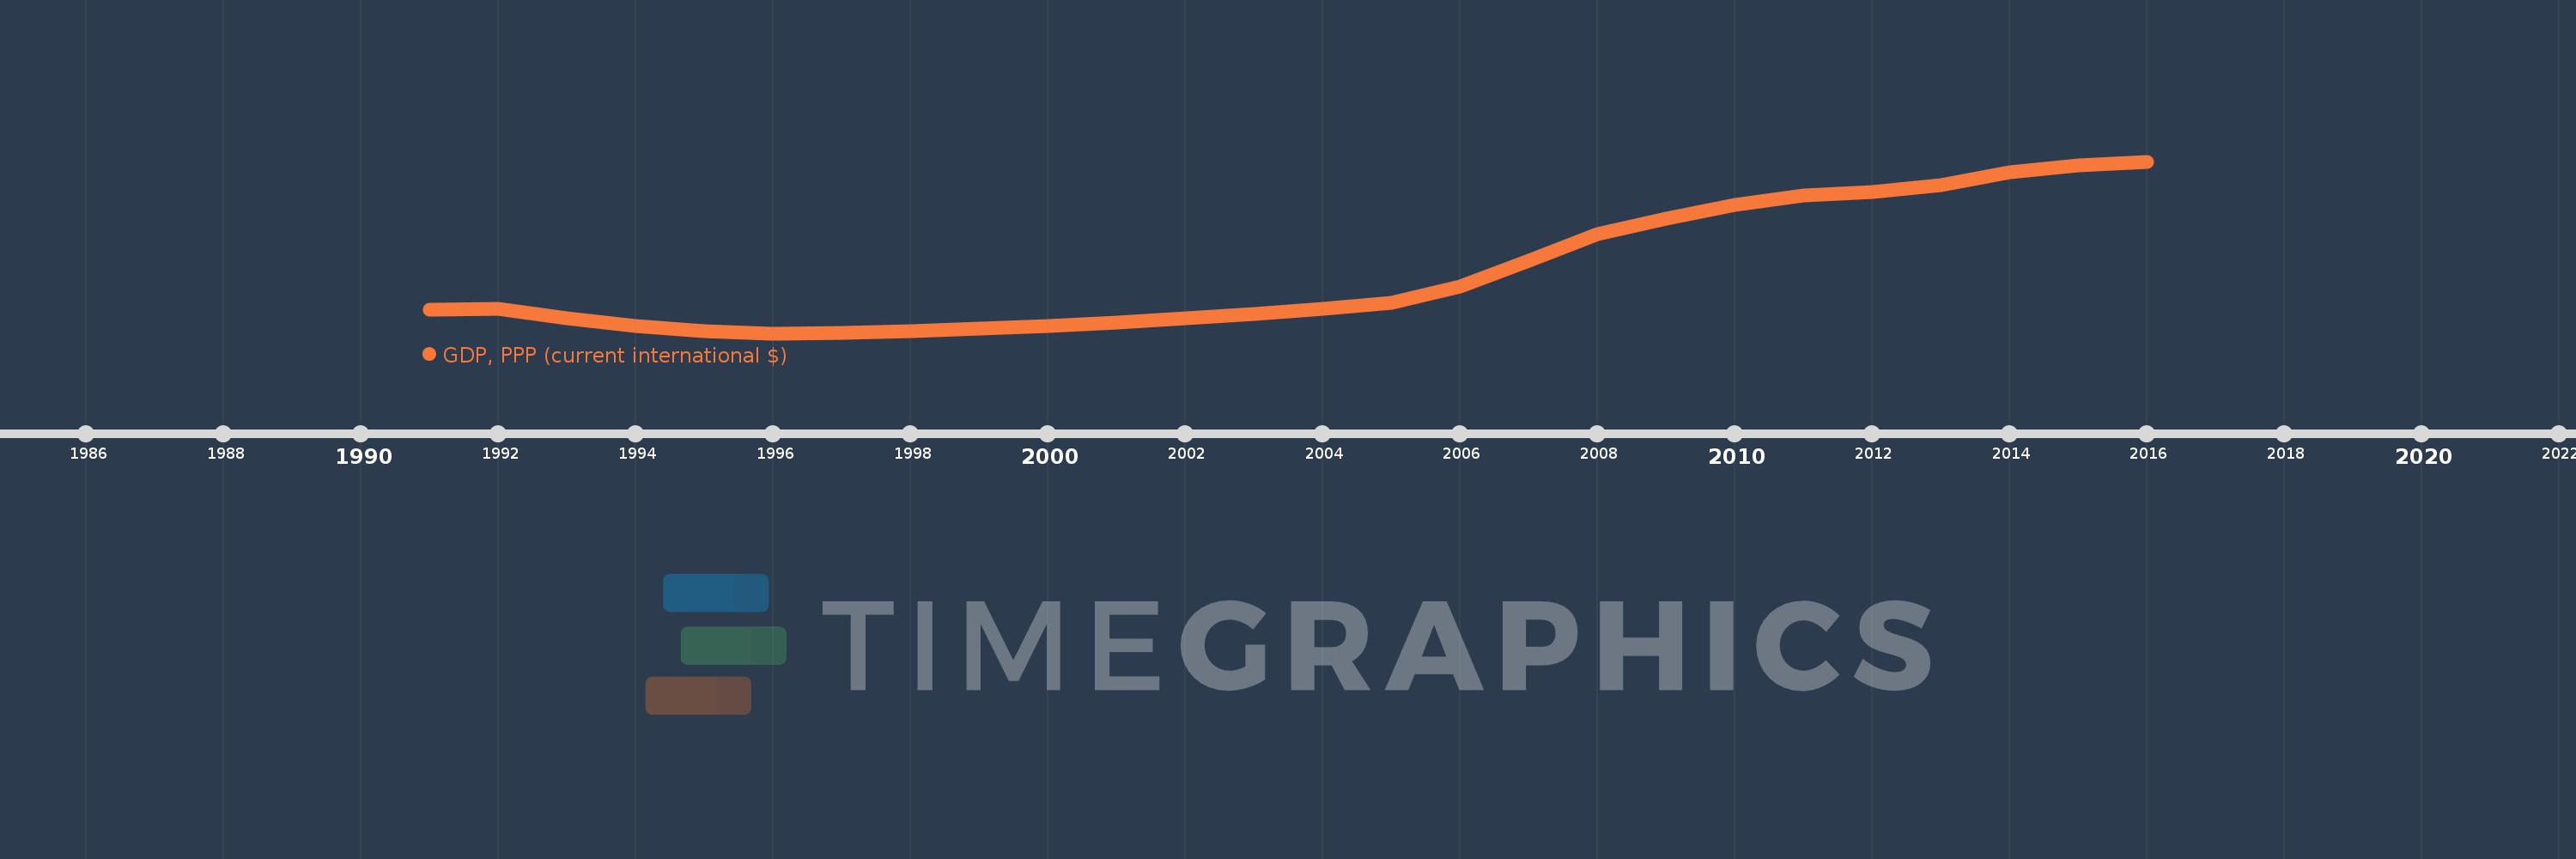
This timeline shows a graph from 1991 to 2016 of Azerbaijan. No data until 1990. Number of actual observations by date: 26.
Source name:
World Development Indicators
Source organization:
World Bank, International Comparison Program database.
Categories, topics:
Economy & Growth
Last updated:
apr 23, 2017
Indicators value changes by year
Minimum:
18.601 bln
jan 1, 1996
Maximum:
171.563 bln
jan 1, 2016
At the date of observation
Value
Absolute change
Change from previous value
jan 1, 1991
39.392 bln
+39.392 bln
0.0%
jan 1, 1992
40.418 bln
+1.026 bln
2.61%
jan 1, 1993
31.997 bln
-8.421 bln
-20.84%
jan 1, 1994
25.191 bln
-6.806 bln
-21.27%
jan 1, 1995
20.659 bln
-4.532 bln
-17.99%
jan 1, 1996
18.601 bln
-2.058 bln
-9.96%
jan 1, 1997
19.187 bln
+585.802 mln
3.15%
jan 1, 1998
20.647 bln
+1.46 bln
7.61%
jan 1, 1999
22.958 bln
+2.311 bln
11.19%
jan 1, 2000
25.035 bln
+2.076 bln
9.04%
jan 1, 2001
28.446 bln
+3.412 bln
13.63%
jan 1, 2002
31.975 bln
+3.529 bln
12.4%
jan 1, 2003
35.907 bln
+3.932 bln
12.3%
jan 1, 2004
40.725 bln
+4.818 bln
13.42%
jan 1, 2005
46.113 bln
+5.388 bln
13.23%
jan 1, 2006
60.162 bln
+14.049 bln
30.47%
jan 1, 2007
83.405 bln
+23.242 bln
38.63%
jan 1, 2008
107.072 bln
+23.668 bln
28.38%
jan 1, 2009
120.933 bln
+13.861 bln
12.95%
jan 1, 2010
133.318 bln
+12.385 bln
10.24%
jan 1, 2011
141.498 bln
+8.179 bln
6.13%
jan 1, 2012
144.514 bln
+3.017 bln
2.13%
jan 1, 2013
150.414 bln
+5.9 bln
4.08%
jan 1, 2014
161.703 bln
+11.289 bln
7.51%
jan 1, 2015
167.89 bln
+6.187 bln
3.83%
jan 1, 2016
171.563 bln
+3.673 bln
2.19%
Ranking of countries by current statistics by years


Comments: