29
/
en
AIzaSyAYiBZKx7MnpbEhh9jyipgxe19OcubqV5w
April 1, 2024
152538
Hungary
HUN
true
2
1
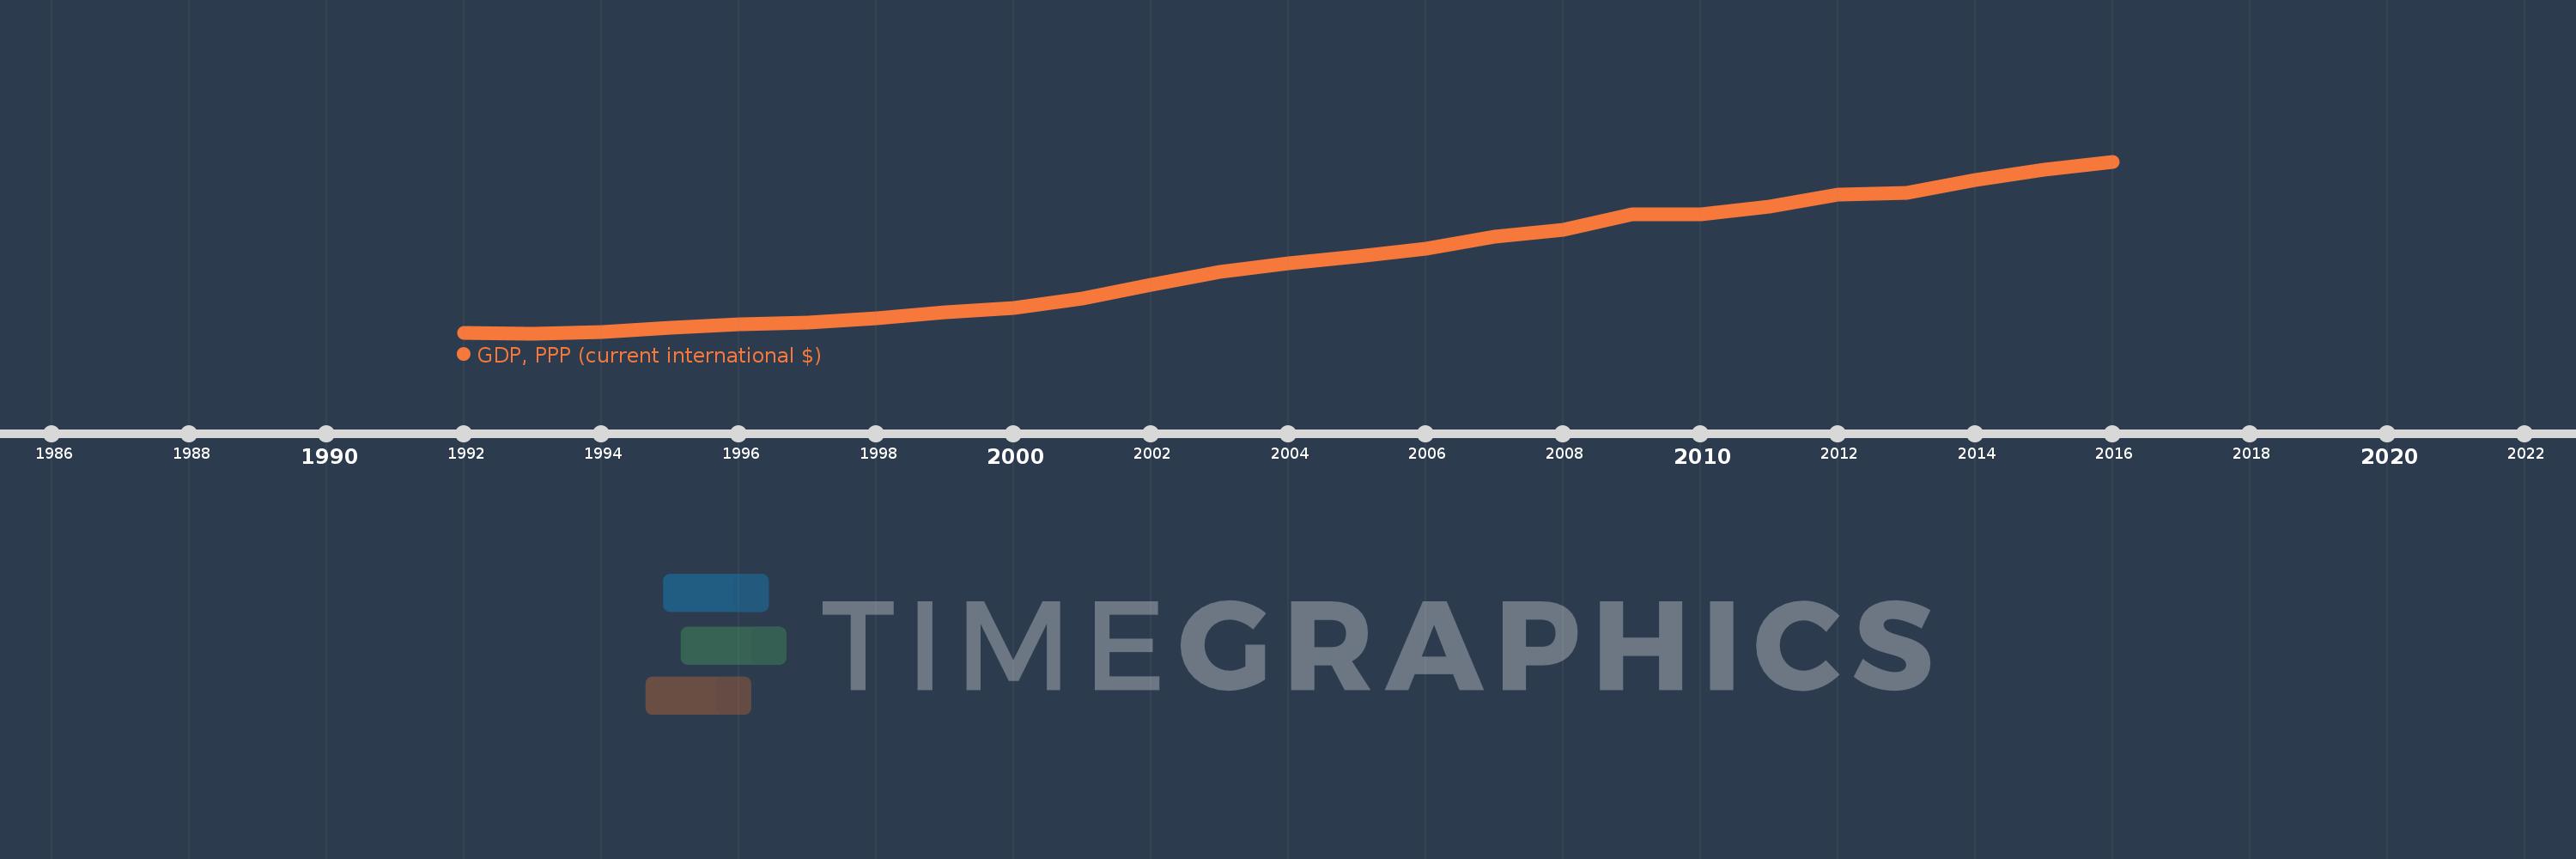
GDP, PPP (current international $)
2016,2015,2014,2013,2012,2011,2010,2009,2008,2007,2006,2005,2004,2003,2002,2001,2000,1999,1998,1997,1996,1995,1994,1993,1992
This statistics in other country:
AfghanistanAlbaniaAlgeriaAngolaAntigua and BarbudaArab WorldArgentinaArmeniaArubaAustraliaAustriaAzerbaijanBahamas, TheBahrainBangladeshBarbadosBelarusBelgiumBelizeBeninBermudaBhutanBoliviaBosnia and HerzegovinaBotswanaBrazilBrunei DarussalamBulgariaBurkina FasoBurundiCabo VerdeCambodiaCameroonCanadaCaribbean small statesCayman IslandsCentral African RepublicCentral Europe and the BalticsChadChileChinaColombiaComorosCongo, Dem. Rep.Congo, Rep.Costa RicaCote d'IvoireCroatiaCubaCyprusCzech RepublicDenmarkDjiboutiDominicaDominican RepublicEarly-demographic dividendEast Asia & PacificEast Asia & Pacific (excluding high income)East Asia & Pacific (IDA & IBRD countries)EcuadorEgypt, Arab Rep.El SalvadorEquatorial GuineaEritreaEstoniaEthiopiaEuro areaEurope & Central AsiaEurope & Central Asia (excluding high income)Europe & Central Asia (IDA & IBRD countries)European UnionFijiFinlandFragile and conflict affected situationsFranceGabonGambia, TheGeorgiaGermanyGhanaGreeceGrenadaGuatemalaGuineaGuinea-BissauGuyanaHaitiHeavily indebted poor countries (HIPC)High incomeHondurasHong Kong SAR, ChinaHungaryIBRD onlyIcelandIDA & IBRD totalIDA blendIDA onlyIDA totalIndiaIndonesiaIran, Islamic Rep.IraqIrelandIsraelItalyJamaicaJapanJordanKazakhstanKenyaKiribatiKorea, Rep.KosovoKuwaitKyrgyz RepublicLao PDRLate-demographic dividendLatin America & Caribbean Latin America & Caribbean (excluding high income)Latin America & the Caribbean (IDA & IBRD countries)LatviaLeast developed countries: UN classificationLebanonLesothoLiberiaLibyaLithuaniaLow & middle incomeLow incomeLower middle incomeLuxembourgMacao SAR, ChinaMacedonia, FYRMadagascarMalawiMalaysiaMaldivesMaliMaltaMarshall IslandsMauritaniaMauritiusMexicoMicronesia, Fed. Sts.Middle East & North AfricaMiddle East & North Africa (excluding high income)Middle East & North Africa (IDA & IBRD countries)Middle incomeMoldovaMongoliaMontenegroMoroccoMozambiqueMyanmarNamibiaNauruNepalNetherlandsNew ZealandNicaraguaNigerNigeriaNorth AmericaNorwayOECD membersOmanOther small statesPacific island small statesPakistanPalauPanamaPapua New GuineaParaguayPeruPhilippinesPolandPortugalPost-demographic dividendPre-demographic dividendPuerto RicoQatarRomaniaRussian FederationRwandaSamoaSao Tome and PrincipeSaudi ArabiaSenegalSerbiaSeychellesSierra LeoneSingaporeSint Maarten (Dutch part)Slovak RepublicSloveniaSmall statesSolomon IslandsSouth AfricaSouth AsiaSouth Asia (IDA & IBRD)South SudanSpainSri LankaSt. Kitts and NevisSt. LuciaSt. Vincent and the GrenadinesSub-Saharan Africa Sub-Saharan Africa (excluding high income)Sub-Saharan Africa (IDA & IBRD countries)SudanSurinameSwazilandSwedenSwitzerlandTajikistanTanzaniaThailandTimor-LesteTogoTongaTrinidad and TobagoTunisiaTurkeyTurkmenistanTuvaluUgandaUkraineUnited Arab EmiratesUnited KingdomUnited StatesUpper middle incomeUruguayUzbekistanVanuatuVenezuela, RBVietnamWest Bank and GazaWorldYemen, Rep.ZambiaZimbabwe Timeline:
This timeline shows a graph from 1992 to 2016 of Hungary. No data until 1991. Number of actual observations by date: 25.
Source name:
World Development Indicators
Source organization:
World Bank, International Comparison Program database.
Categories, topics:
Economy & Growth
Last updated:
apr 23, 2017
Indicators value changes by year
Minimum:
85.189 bln
jan 1, 1993
Maximum:
260.423 bln
jan 1, 2016
At the date of observation
Value
Absolute change
Change from previous value
jan 1, 1992
85.923 bln
+85.923 bln
0.0%
jan 1, 1993
85.189 bln
-734.197 mln
-0.85%
jan 1, 1994
86.713 bln
+1.524 bln
1.79%
jan 1, 1995
91.169 bln
+4.455 bln
5.14%
jan 1, 1996
94.457 bln
+3.288 bln
3.61%
jan 1, 1997
96.066 bln
+1.61 bln
1.7%
jan 1, 1998
100.768 bln
+4.701 bln
4.89%
jan 1, 1999
106.544 bln
+5.776 bln
5.73%
jan 1, 2000
111.318 bln
+4.774 bln
4.48%
jan 1, 2001
120.933 bln
+9.615 bln
8.64%
jan 1, 2002
134.788 bln
+13.855 bln
11.46%
jan 1, 2003
147.464 bln
+12.676 bln
9.4%
jan 1, 2004
156.174 bln
+8.71 bln
5.91%
jan 1, 2005
163.725 bln
+7.551 bln
4.84%
jan 1, 2006
171.625 bln
+7.9 bln
4.83%
jan 1, 2007
183.601 bln
+11.977 bln
6.98%
jan 1, 2008
190.395 bln
+6.794 bln
3.7%
jan 1, 2009
206.647 bln
+16.252 bln
8.54%
jan 1, 2010
206.2 bln
-447.288 mln
-0.22%
jan 1, 2011
214.666 bln
+8.466 bln
4.11%
jan 1, 2012
226.649 bln
+11.983 bln
5.58%
jan 1, 2013
228.146 bln
+1.497 bln
0.66%
jan 1, 2014
241.276 bln
+13.13 bln
5.76%
jan 1, 2015
251.761 bln
+10.485 bln
4.35%
jan 1, 2016
260.423 bln
+8.662 bln
3.44%
Ranking of countries by current statistics by years


Comments: