29
/
en
AIzaSyAYiBZKx7MnpbEhh9jyipgxe19OcubqV5w
April 1, 2024
273591
Ukraine
UKR
true
2
1
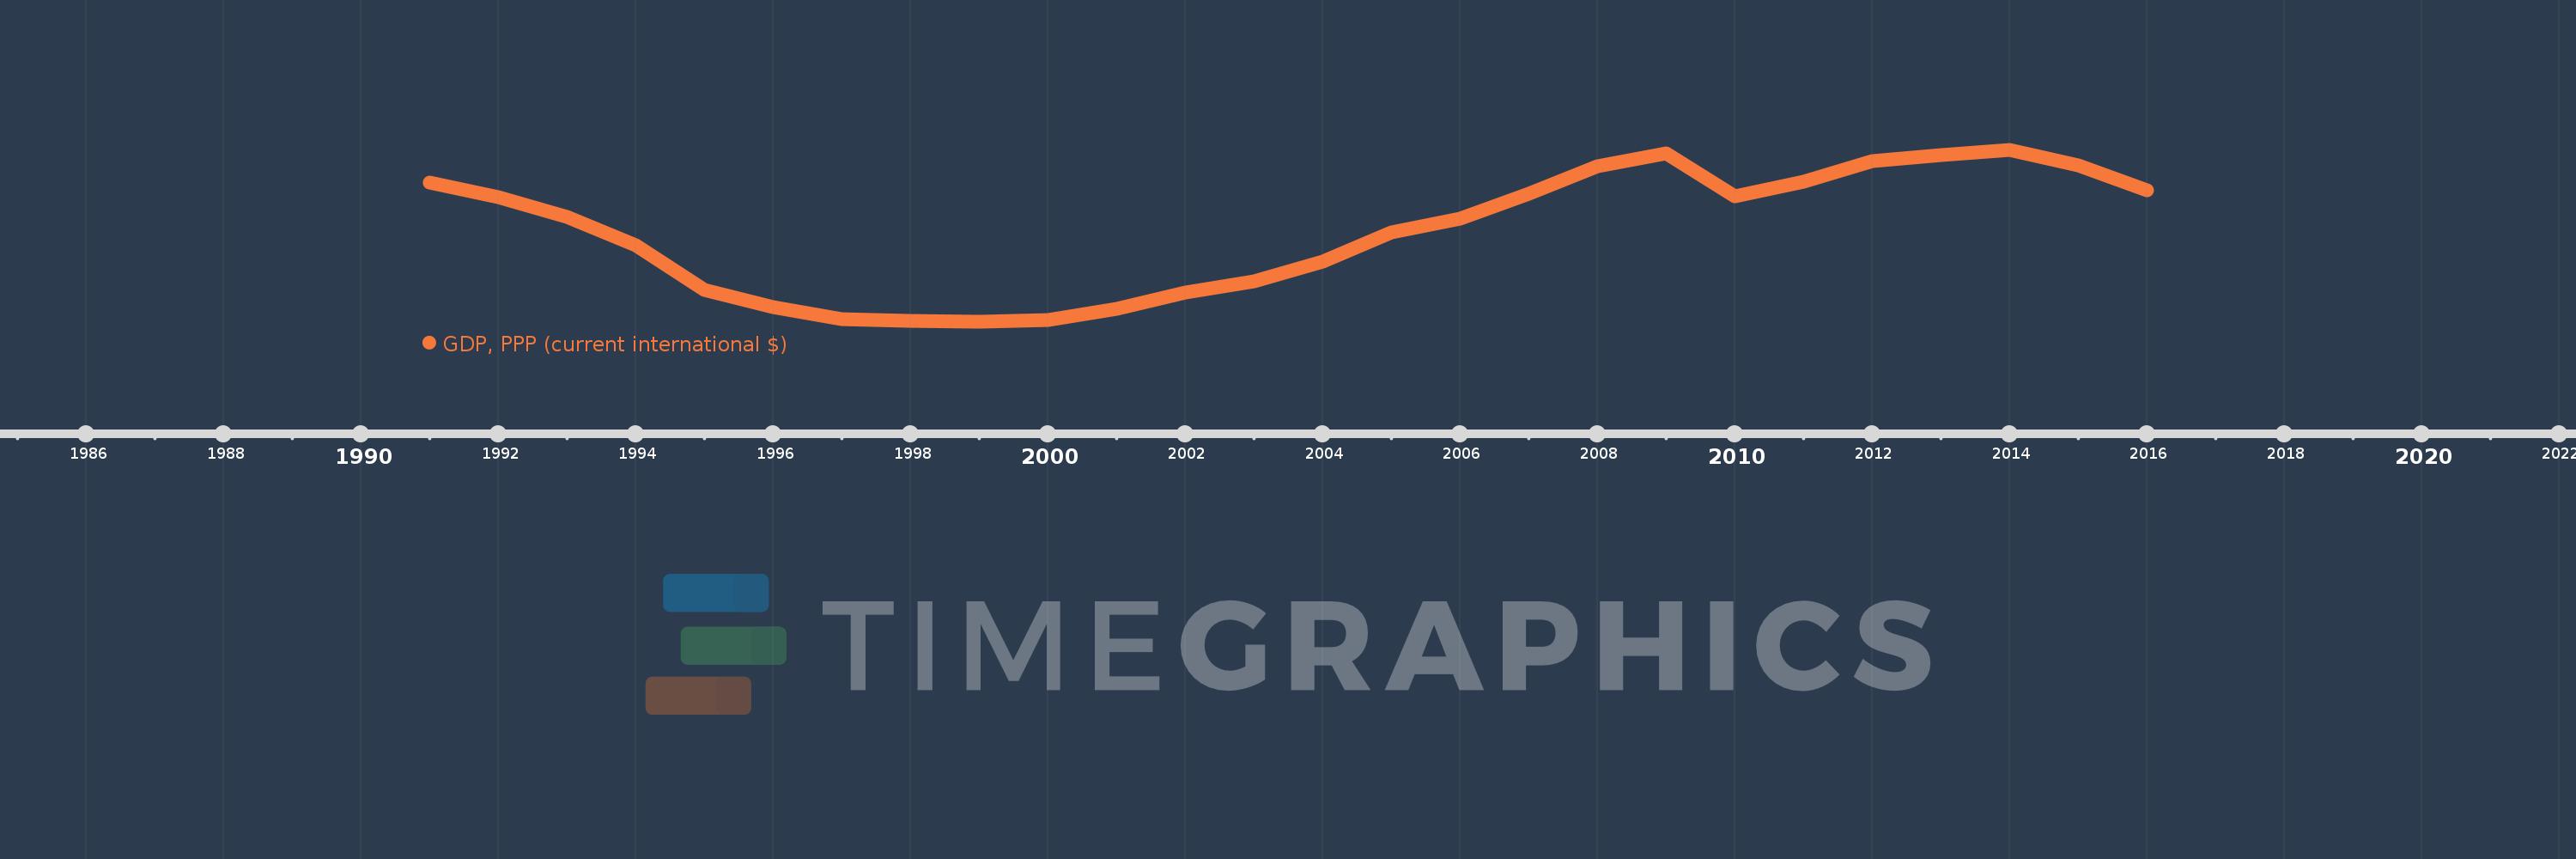
GDP, PPP (current international $)
2016,2015,2014,2013,2012,2011,2010,2009,2008,2007,2006,2005,2004,2003,2002,2001,2000,1999,1998,1997,1996,1995,1994,1993,1992,1991
This statistics in other country:
AfghanistanAlbaniaAlgeriaAngolaAntigua and BarbudaArab WorldArgentinaArmeniaArubaAustraliaAustriaAzerbaijanBahamas, TheBahrainBangladeshBarbadosBelarusBelgiumBelizeBeninBermudaBhutanBoliviaBosnia and HerzegovinaBotswanaBrazilBrunei DarussalamBulgariaBurkina FasoBurundiCabo VerdeCambodiaCameroonCanadaCaribbean small statesCayman IslandsCentral African RepublicCentral Europe and the BalticsChadChileChinaColombiaComorosCongo, Dem. Rep.Congo, Rep.Costa RicaCote d'IvoireCroatiaCubaCyprusCzech RepublicDenmarkDjiboutiDominicaDominican RepublicEarly-demographic dividendEast Asia & PacificEast Asia & Pacific (excluding high income)East Asia & Pacific (IDA & IBRD countries)EcuadorEgypt, Arab Rep.El SalvadorEquatorial GuineaEritreaEstoniaEthiopiaEuro areaEurope & Central AsiaEurope & Central Asia (excluding high income)Europe & Central Asia (IDA & IBRD countries)European UnionFijiFinlandFragile and conflict affected situationsFranceGabonGambia, TheGeorgiaGermanyGhanaGreeceGrenadaGuatemalaGuineaGuinea-BissauGuyanaHaitiHeavily indebted poor countries (HIPC)High incomeHondurasHong Kong SAR, ChinaHungaryIBRD onlyIcelandIDA & IBRD totalIDA blendIDA onlyIDA totalIndiaIndonesiaIran, Islamic Rep.IraqIrelandIsraelItalyJamaicaJapanJordanKazakhstanKenyaKiribatiKorea, Rep.KosovoKuwaitKyrgyz RepublicLao PDRLate-demographic dividendLatin America & Caribbean Latin America & Caribbean (excluding high income)Latin America & the Caribbean (IDA & IBRD countries)LatviaLeast developed countries: UN classificationLebanonLesothoLiberiaLibyaLithuaniaLow & middle incomeLow incomeLower middle incomeLuxembourgMacao SAR, ChinaMacedonia, FYRMadagascarMalawiMalaysiaMaldivesMaliMaltaMarshall IslandsMauritaniaMauritiusMexicoMicronesia, Fed. Sts.Middle East & North AfricaMiddle East & North Africa (excluding high income)Middle East & North Africa (IDA & IBRD countries)Middle incomeMoldovaMongoliaMontenegroMoroccoMozambiqueMyanmarNamibiaNauruNepalNetherlandsNew ZealandNicaraguaNigerNigeriaNorth AmericaNorwayOECD membersOmanOther small statesPacific island small statesPakistanPalauPanamaPapua New GuineaParaguayPeruPhilippinesPolandPortugalPost-demographic dividendPre-demographic dividendPuerto RicoQatarRomaniaRussian FederationRwandaSamoaSao Tome and PrincipeSaudi ArabiaSenegalSerbiaSeychellesSierra LeoneSingaporeSint Maarten (Dutch part)Slovak RepublicSloveniaSmall statesSolomon IslandsSouth AfricaSouth AsiaSouth Asia (IDA & IBRD)South SudanSpainSri LankaSt. Kitts and NevisSt. LuciaSt. Vincent and the GrenadinesSub-Saharan Africa Sub-Saharan Africa (excluding high income)Sub-Saharan Africa (IDA & IBRD countries)SudanSurinameSwazilandSwedenSwitzerlandTajikistanTanzaniaThailandTimor-LesteTogoTongaTrinidad and TobagoTunisiaTurkeyTurkmenistanTuvaluUgandaUkraineUnited Arab EmiratesUnited KingdomUnited StatesUpper middle incomeUruguayUzbekistanVanuatuVenezuela, RBVietnamWest Bank and GazaWorldYemen, Rep.ZambiaZimbabwe Timeline:
This timeline shows a graph from 1991 to 2016 of Ukraine. No data until 1990. Number of actual observations by date: 26.
Source name:
World Development Indicators
Source organization:
World Bank, International Comparison Program database.
Categories, topics:
Economy & Growth
Last updated:
apr 23, 2017
Indicators value changes by year
Minimum:
170.385 bln
jan 1, 1999
Maximum:
392.561 bln
jan 1, 2014
At the date of observation
Value
Absolute change
Change from previous value
jan 1, 1991
350.956 bln
+350.956 bln
0.0%
jan 1, 1992
332.138 bln
-18.819 bln
-5.36%
jan 1, 1993
306.76 bln
-25.377 bln
-7.64%
jan 1, 1994
269.381 bln
-37.38 bln
-12.19%
jan 1, 1995
212.019 bln
-57.362 bln
-21.29%
jan 1, 1996
190.035 bln
-21.984 bln
-10.37%
jan 1, 1997
174.154 bln
-15.881 bln
-8.36%
jan 1, 1998
171.82 bln
-2.333 bln
-1.34%
jan 1, 1999
170.385 bln
-1.435 bln
-0.84%
jan 1, 2000
172.647 bln
+2.261 bln
1.33%
jan 1, 2001
186.993 bln
+14.347 bln
8.31%
jan 1, 2002
208.85 bln
+21.857 bln
11.69%
jan 1, 2003
223.083 bln
+14.233 bln
6.81%
jan 1, 2004
248.919 bln
+25.836 bln
11.58%
jan 1, 2005
286.711 bln
+37.792 bln
15.18%
jan 1, 2006
303.927 bln
+17.216 bln
6.0%
jan 1, 2007
336.133 bln
+32.206 bln
10.6%
jan 1, 2008
372.34 bln
+36.207 bln
10.77%
jan 1, 2009
388.375 bln
+16.036 bln
4.31%
jan 1, 2010
333.409 bln
-54.967 bln
-14.15%
jan 1, 2011
351.655 bln
+18.246 bln
5.47%
jan 1, 2012
378.532 bln
+26.877 bln
7.64%
jan 1, 2013
386.425 bln
+7.893 bln
2.09%
jan 1, 2014
392.561 bln
+6.136 bln
1.59%
jan 1, 2015
373.405 bln
-19.155 bln
-4.88%
jan 1, 2016
340.172 bln
-33.233 bln
-8.9%
Ranking of countries by current statistics by years


Comments: